Mastering Kanban in Project Management:
Visual Workflow Control from Factory to Office
A comprehensive guide to Kanban — the visual workflow management method born on Toyota's factory floor in the 1940s and now used by millions of teams worldwide in manufacturing, software, engineering, healthcare, and knowledge work. Covers the Kanban board, WIP limits and Little's Law, flow metrics (Lead Time, Cycle Time, Throughput), 4 principles, 6 practices, 5 cadences, push vs pull, factory vs project Kanban, and a practical implementation roadmap.
What is Kanban? The Visual Signal That Changed Manufacturing
The word Kanban (看板) is Japanese for "signboard" or "signal card." In its most elemental form, a Kanban is a visual signal — a physical or digital card that communicates information about work: what needs to be made, how much, and when. But Kanban as a management methodology is far more than a card system. It is a complete philosophy of workflow management built on a single, powerful insight: work flows better when it is pulled by demand than pushed by schedule, and visibility of the flow is the prerequisite of its improvement.
Kanban is a visual workflow management method that helps teams see all their work, limit how much work they take on simultaneously, and continuously improve how work flows through their system. The defining characteristic that separates Kanban from a simple task list is the WIP (Work In Progress) limit — a constraint on how many items can exist in any stage of the workflow at one time, creating a pull system where new work is only started when capacity is available.
Kanban's genius is its universality. The same principles that prevented inventory pileups on Toyota's assembly lines in 1947 now prevent task overload in software teams, prevent bottlenecks in hospital operating schedules, and improve throughput in engineering project offices. The visual board, the WIP limit, and the pull system are not technology-specific or industry-specific — they are universal principles of workflow that apply wherever work moves through stages.
Stop starting, start finishing. This one phrase captures the essence of Kanban WIP limits. Conventional wisdom says the more you start, the more you'll complete. Kanban's data — and Little's Law — prove the opposite. Limiting concurrent work, counterintuitively, delivers more output than maximising concurrent work.
— David J. Anderson, Kanban: Successful Evolutionary Change for Your Technology Business (2010)History — From Toyota's Factory Floor to the World's Offices
Taiichi Ohno, Toyota's Chief Engineer, developed the Kanban system in the late 1940s while working to eliminate waste from Toyota's production system. Ohno observed that Toyota's factories were plagued by the same problem as most manufacturers: upstream processes produced parts on a schedule, regardless of whether downstream processes were ready to use them. Parts piled up as inventory between workstations — waste, space, cost, and hidden quality problems accumulating in the gaps between operations. The conventional solution was better planning and forecasting — predicting demand more accurately so that production schedules could align perfectly with consumption. Ohno rejected this approach. Perfect forecasting is impossible in a complex system. Instead, he inverted the production signal: rather than upstream processes pushing parts forward, downstream processes would pull parts from upstream by sending a Kanban card signal: "I have used this material — please send more."
This simple innovation — the pull system signalled by a physical card — became the foundation of the Toyota Production System (TPS) and subsequently of Lean Manufacturing globally. The physical Kanban card (originally a card in a clear plastic sleeve attached to a bin of parts) carried standardised information: part number, quantity, source process, destination process. When a bin was emptied, the card was sent back upstream as a replenishment signal. Nothing was produced without a Kanban signal. Inventory was limited to the number of Kanban cards in circulation for each part. The system self-regulated: demand pulled production; WIP was limited by the number of cards; bottlenecks became immediately visible as card accumulation.
For five decades, Kanban remained a manufacturing concept. In 2004, David J. Anderson, working at Microsoft, applied Kanban's core principles — visualise work, limit WIP, manage flow — to software feature development. The results were dramatic: reducing the development team's WIP from 25 concurrent features to 5 reduced average lead time by 50%. Anderson formalised this application into the Kanban Method for knowledge work, publishing the foundational text Kanban: Successful Evolutionary Change for Your Technology Business in 2010 and establishing the Lean Kanban University (now Kanban University) to standardise training and certification. By 2025, Kanban is used by millions of teams across every industry — from Toyota's original factory applications to hospital emergency departments, marketing agencies, government agencies, and every variety of engineering team.
The 4 Core Principles & 6 General Practices
The Kanban Method, as defined by David Anderson and formalised by Kanban University, is built on two sets of foundational guidance: four change management principles that guide how Kanban is adopted, and six general practices that define what Kanban teams do. Together they form a complete framework for implementing and sustaining Kanban in any organisation.
The 4 Core Principles
Kanban does not require you to abandon your existing process, roles, responsibilities, or titles. It starts with the current workflow — making it visible — and improves from there. This makes Kanban uniquely non-disruptive: teams can begin a Kanban implementation on Monday morning without reorganising the team, replacing the methodology, or undergoing a cultural revolution. Map what you actually do, visualise it, and start improving.
Kanban advocates gradual, continuous improvement rather than radical transformation. Dramatic, disruptive changes to an organisation's workflow typically create resistance, instability, and loss of institutional knowledge. Kanban's evolutionary approach — small, safe-to-fail experiments that generate data, then informed adjustments — produces sustainable improvement that the organisation can absorb and sustain without disruption.
Existing processes and roles have value — they exist because they solved real problems at some point. Kanban respects them even while working to improve them. This differs sharply from Scrum, which requires specific new roles (Product Owner, Scrum Master) and eliminates existing titles. Kanban can be applied by a team of managers, engineers, and analysts retaining their current titles and reporting structures — the Kanban board improves their workflow without requiring organisational restructuring.
In Kanban, leadership is not a positional title — it is an act. Anyone on the team who identifies an improvement, raises a blocker, or challenges a counterproductive norm is acting as a leader. Kanban actively encourages this distributed leadership because the people closest to the work have the most accurate information about where the workflow fails and what would improve it.
The 6 General Practices
Make all work visible on the Kanban board. Every item — planned features, bugs, support requests, technical debt, experiments — gets a card. Hidden work cannot be managed. The board makes the total demand on the team visible to everyone, including the work that is invisible in most traditional management systems: the unplanned work, the urgent interruptions, the long-running investigations that consume capacity without appearing on any project plan.
Set a maximum number of items allowed in each column (stage) simultaneously. This is the defining practice of Kanban — the one that converts a task board into a flow management system. WIP limits prevent multitasking, reveal bottlenecks, and force the team to focus on finishing rather than starting. Without WIP limits, the board is a to-do list; with them, it is a pull system.
Monitor how work items move through the system. Track where items stall, accumulate, or accelerate. The goal is a smooth, predictable flow — not a sprint where everyone rushes at the end. Flow management uses metrics (Lead Time, Cycle Time, Throughput) to identify systemic problems and prioritise improvements that accelerate the movement of work through the system.
Define and communicate the rules of the workflow: what does it mean for an item to be "ready" to enter a column? What are the acceptance criteria for "Done"? Who can pull work from the backlog? When is an item blocked vs in progress? Explicit policies prevent the confusion, inconsistency, and arguments that arise when each team member has different assumptions about how the process works.
Regular cadences — daily standups, replenishment meetings, service delivery reviews, operations reviews, and strategy reviews — provide the inspection and adaptation mechanism that drives continuous improvement. Kanban defines five standard cadences, each operating at a different frequency and addressing a different level of the system.
Use models and the scientific method: form a hypothesis ("If we reduce the WIP limit in Review from 5 to 3, cycle time will decrease"), run the experiment, measure the result, and adjust. Kanban improvement is data-driven and collaborative — decisions are made on flow metrics, not opinions. Small, safe-to-fail experiments outperform sweeping methodological revolutions.
The Kanban Board — Anatomy & Design
The Kanban board is the centrepiece of the method — the visual representation of the workflow that makes all work and its progress visible to the entire team. A well-designed Kanban board is not a simple status board; it is an accurate, real-time model of how work actually flows through the team's process, with every item, every stage, and every WIP limit visible at a glance.
A Kanban board has three key components: Columns represent stages in the workflow — typically a card moves left to right from backlog through active stages to done. Columns should reflect the team's actual process, not an idealised version of it. A software team might have Backlog → Analysis → Development → Code Review → Testing → Deployment → Done. An engineering team might have Backlog → Design → Prototyping → Validation → Release. Cards represent individual work items — each card captures the key information: item name, owner, due date, priority, and any relevant links. Cards make work tangible and visible; a team can immediately see how many items are in each stage. Swimlanes are horizontal divisions of the board that allow different categories of work (features vs. bugs, or different product lines) to be tracked separately within the same workflow.
The WIP limit displayed in each column header is the board's most important feature. When a column exceeds its limit, the column header typically turns red — an immediate visual signal that the team has too much work in that stage. The correct response is: stop pulling new work into that stage, and instead swarm on the blocked items in the over-limit column to get them moving. This is how Kanban makes bottlenecks visible and creates the team behaviour of collaborative problem-solving rather than individual task completion.
WIP Limits & Little's Law — The Mathematics of Flow
WIP limits are the heart of Kanban. They are the mechanism that transforms a visual task board into a pull system, and they are supported by one of the most powerful laws in operations management: Little's Law.
Little's Law (John D.C. Little, MIT, 1961): Lead Time = WIP ÷ Throughput. In a stable system, the average time an item spends in the system (Lead Time) equals the average number of items in the system (WIP) divided by the average rate at which items leave the system (Throughput). The implication is direct and non-obvious: to reduce Lead Time, reduce WIP — not by hiring more people, not by working longer hours, but by limiting how many items are in progress simultaneously.
Little's Law reveals a counterintuitive truth: the way to deliver work faster is not to start more work, but to limit how much work is in progress. When WIP is high, items spend most of their time waiting — waiting for the next stage to become available, waiting for a reviewer, waiting for a dependent task to complete. Reducing WIP directly reduces waiting time, and waiting time is the dominant component of lead time in most knowledge work environments.
How to Set WIP Limits
There is no universal formula for the "correct" WIP limit. The Kanban community recommends starting with a simple heuristic and adjusting based on observed flow: Start with WIP limit = number of team members working on that stage × 1.5. For a Review stage with 2 reviewers, start with a WIP limit of 3. Then observe: if the column is always under the limit, the limit may be too high. If the column is always at the limit and items are stacking up, the stage is a bottleneck — address the root cause (insufficient capacity, unclear acceptance criteria, dependency on external approvers) rather than simply raising the limit.
| Scenario | WIP Limit Status | What It Means | Correct Response |
|---|---|---|---|
| Column always below limit | Healthy | The stage has excess capacity — work flows through without congestion | Consider tightening the limit to reveal hidden bottlenecks earlier in the pipeline |
| Column regularly at limit | Monitor | Normal flow — the stage is running at capacity but not blocking downstream | Watch for limit violations; this is acceptable steady-state operation |
| Column frequently exceeds limit | Bottleneck | The stage is a bottleneck — items arrive faster than they leave | Swarm: stop pulling new work in; focus all available capacity on clearing the stage. Investigate root cause: missing skills, unclear criteria, dependencies, insufficient people |
| Single item aged for >3× average cycle time | Blocker | An individual item is stuck — not a throughput problem but a specific impediment | Escalate immediately. Use an explicit "Blocked" marker. Conduct a blocker retrospective to prevent recurrence |
Flow Metrics — Measuring What Matters in Kanban
Kanban is a data-driven method. Where Scrum uses velocity (story points per sprint) as its primary performance indicator, Kanban uses flow metrics — measurements that directly reflect how well work is moving through the system. Three metrics are foundational: Lead Time, Cycle Time, and Throughput.
The total time from when a work item is requested (added to the backlog) to when it is delivered (reaches Done). Lead Time is what the customer experiences — it answers "how long did I have to wait?" Lead Time includes all waiting time in the backlog before work begins. Reducing Lead Time is the ultimate goal of Kanban flow improvement.
The time from when work actively begins (moved to In Progress) to when it is Done. Cycle Time is what the team controls — it reflects how long it takes to complete work once the team commits to it. Cycle Time excludes backlog waiting time and is more controllable by the team than Lead Time.
The number of work items completed per unit time (typically per week). Throughput measures the team's delivery capacity. Combined with WIP (via Little's Law), it directly determines Lead Time. Improving throughput without reducing WIP does not reduce Lead Time proportionally — because Little's Law shows the relationship is multiplicative, not additive.
Beyond the three core metrics, Kanban teams use two powerful visualisations: the Cumulative Flow Diagram (CFD) — a stacked area chart showing how many items are in each stage over time, which reveals when WIP is growing in a stage (widening band = accumulating inventory = emerging bottleneck) — and the Scatterplot / Control Chart — plotting the cycle time of every completed item, which shows the spread of delivery times and enables Service Level Agreement (SLA) commitments: "85% of our items complete within 5 days."
Kanban Cadences — The 5 Feedback Loops
Unlike Scrum, which mandates four specific ceremonies at fixed intervals within a sprint, Kanban defines five cadences — regular meetings that operate at different frequencies to serve different purposes. Not all five are required immediately; teams often start with the Daily Standup and add cadences as their Kanban practice matures.
| Cadence | Frequency | Duration | Purpose | Participants |
|---|---|---|---|---|
| Daily Standup | Daily | 15 min | Inspect flow status. Walk the board right-to-left (Done to Backlog). Identify blockers, ageing items, WIP violations. Focus on the work, not the people: "What is blocking this card?" not "What did you do yesterday?" | Whole team |
| Replenishment Meeting | Weekly | 30–60 min | Review items ready to enter the system. Apply selection criteria (priority, readiness, capacity). Pull new work into the backlog top only if within WIP limits. This meeting explicitly governs the intake of new work — preventing uncontrolled scope creep. | PO / team lead + key stakeholders |
| Kanban Meeting (Queue Replenishment) | Daily / as needed | 15 min | Coordinate the pull of work between stages. Decide what moves from Analysis to Development, from Development to Review, etc. Ensures smooth flow between stages without creating artificial batch transfers. | Developers |
| Service Delivery Review | Bi-weekly / Monthly | 1 hour | Review completed work and delivery performance. Analyse Lead Time, Cycle Time, Throughput metrics. Identify systemic problems — items that repeatedly age, stages that are consistently bottlenecks. Discuss with customers or stakeholders. | Team + stakeholders |
| Operations Review | Monthly | 1–2 hours | Broader performance review across multiple teams or workstreams. Identify interdependencies and systemic issues that span team boundaries. Review capacity, demand, and strategic fit of current work portfolio. | Management + team leads |
Factory Kanban vs Project Kanban — Same Principles, Different Forms
The physical card-based Kanban system used in Toyota's factories and the digital board-based Kanban used in project management teams share the same foundational principles but differ significantly in their physical form, the nature of the signals, and the type of work they manage.
| Dimension | Factory Kanban (Manufacturing) | Project Kanban (Knowledge Work) |
|---|---|---|
| Physical Form | ||
| Signal medium | Physical card (card in plastic sleeve attached to parts bin), bin, or container. Electronic Kanban (eKanban) in modern factories uses barcode/RFID scan to generate digital signal. | Physical sticky note on whiteboard, or digital card in Jira, Trello, ClickUp, Azure DevOps |
| Work item | A batch of physical parts or materials — the Kanban authorises the production or movement of a specific quantity (e.g., "produce 50 units of Part #A1234") | An abstract work item — a feature, user story, bug, task, or experiment. Quantity is always "1" per card. |
| Pull System Mechanics | ||
| Pull signal direction | Downstream process sends card upstream when it consumes parts — "I have consumed, please produce more." Signal moves opposite to material flow. | Team member "pulls" a card from one column to the next when capacity is available — work moves forward when the person is ready, not when the upstream stage decides. |
| WIP constraint | Limited by the total number of Kanban cards in circulation for each part number. Adding or removing cards changes the WIP level. | Limited by explicit WIP limit numbers on each column. Team enforces the limits through team agreement and discipline. |
| Performance Metrics | ||
| Key metrics | Inventory turns, parts per hour, takt time adherence, defect rate, changeover time (SMED) | Lead Time, Cycle Time, Throughput, Flow Efficiency (value-adding time ÷ total lead time) |
| Improvement approach | VSM (Value Stream Mapping) to identify waste, SMED for changeover reduction, Jidoka for quality stops | Cumulative Flow Diagram to identify bottlenecks, Lead Time scatter plots, Throughput analysis |
When you understand that the Kanban card in a Toyota factory and the digital Kanban card in Jira are governed by the same mathematical law — Little's Law — and the same operational principle — pull, not push — the apparent difference between manufacturing and knowledge work evaporates. Workflow is workflow. Bottlenecks are bottlenecks. WIP limits work in both environments for the same reason.
— David J. Anderson, Kanban: Successful Evolutionary Change for Your Technology BusinessKanban vs Scrum — Two Agile Methods, Different Problems
| Dimension | Kanban | Scrum |
|---|---|---|
| Cadence | Continuous flow — no fixed iterations. Work moves through the system at its natural pace. | Fixed-length Sprints (1–4 weeks). All work planned and delivered within the sprint cycle. |
| Roles | No prescribed roles. Existing titles and responsibilities retained. Leadership encouraged at all levels. | Three specific accountabilities: Product Owner, Scrum Master, Developers. Existing titles may be retired. |
| Ceremonies | Five flexible cadences — teams adopt those that add value. No mandated meetings. | Five mandatory events: Sprint, Sprint Planning, Daily Scrum, Sprint Review, Sprint Retrospective. |
| Change management | Changes can be made at any time — no sprint to protect. Work items can be reprioritised mid-flow. | Sprint Goal is protected — scope changes within a sprint are discouraged to preserve team focus. |
| Planning horizon | Just-in-time planning — only enough planning to keep the queue full. No sprint commitment. | Sprint commitment — team commits to completing the Sprint Goal and selected backlog items. |
| Metrics | Flow metrics: Lead Time, Cycle Time, Throughput, CFD. Continuous measurement. | Sprint velocity (story points per sprint). Burndown chart. Measured at sprint boundaries. |
| Best for | Operational teams, maintenance work, continuous delivery, unpredictable demand patterns, mature teams improving an established process | Product development, new feature development, teams building something new iteratively, cross-functional teams with a clear Product Owner |
| Transition cost | Low — start with current process, visualise it, add WIP limits. No structural change required. | Higher — requires new roles (PO, SM), new ceremonies, team reorganisation, and cultural shift |
Scrumban — the popular hybrid — combines Scrum's sprint cadence and team structure with Kanban's WIP limits and flow metrics. Many teams use Scrum ceremonies (sprint planning, daily standup, retrospective) but add Kanban WIP limits to their sprint board to prevent mid-sprint overload. This is often the most practical starting point for teams transitioning from Scrum toward Kanban, or for teams that need the structure of sprint commitments combined with Kanban's flow transparency.
Kanban Tools for 2025–2026 & Common Anti-Patterns
Industry standard for engineering Kanban. Full-featured boards with configurable WIP limits, swimlanes, CFD reporting, cycle time analytics, and backlog management. Best for software, embedded systems, and digital manufacturing teams. Integrates with CI/CD pipelines for automated card movement.
The simplest digital Kanban implementation — cards, lists (columns), and boards. Excellent for small teams and non-technical stakeholders. WIP limits via Butler automation or the WIP limit Power-Up. Best for office teams, marketing, and simple engineering task tracking.
All-in-one PM tool with strong Kanban board view, WIP limits, swimlanes, and flow metrics. Excellent value for SME manufacturing teams managing engineering tasks, improvement projects, and NPI activities alongside their Kanban board.
Microsoft's engineering platform with excellent Kanban boards including WIP limits, cumulative flow diagrams, and cycle time charts. Best for teams already in the Microsoft ecosystem — automotive software, industrial control systems, factory automation software.
Purpose-built enterprise Kanban tool with advanced flow analytics, portfolio Kanban (multiple levels of cards), and sophisticated WIP limit management. Preferred by mature Kanban teams needing full Little's Law analytics, Monte Carlo simulations, and SLA forecasting.
A whiteboard, magnetic board, or even a wall with masking tape columns and sticky notes. For collocated teams, the physical board has undeniable advantages: always visible, zero login friction, promotes natural standing conversations. Many experienced Kanban teams prefer physical boards for their Daily Standup despite using digital tools for recording.
- WIP limits are respected — team stops pulling new work when columns are at limit
- Bottlenecks are immediately visible as red/over-limit columns — and the team swarms on them
- Lead Time is decreasing or stable and predictable — SLA commitments can be made with data
- The Daily Standup focuses on cards, not people — "This card has been stuck for 3 days" not "Here's my status"
- Throughput is stable — the team knows how much work it can reliably complete per week
- Ageing items are immediately visible and escalated — no card sits in a column for weeks unnoticed
- No WIP limits: The most common failure — a board with columns but no limits is just a visual to-do list, not a Kanban system
- WIP limits that are never enforced: Setting limits but allowing consistent violations — "just this once" becomes the norm
- Raising WIP limits to solve bottlenecks: Increasing the limit hides the bottleneck; the correct response is to address its root cause
- Cards that never move: Ageing items that sit in columns indefinitely — no ageing policy, no escalation mechanism
- Too many columns: A 12-column board with every minor status variation — creates cognitive overhead and unclear ownership
- Walking the board left-to-right in standups: Starting from Backlog in the standup focuses on what's starting; starting from Done focuses on what's finishing — always walk right-to-left
Implementation Roadmap & Summary
Create a Kanban board with columns that reflect your real workflow — not the idealised process, but what actually happens. Include every stage: backlog, active stages, waiting stages, review, and done. Add every current work item as a card. Include all work — planned tasks, support requests, interruptions, and meetings that consume significant capacity. Now, for the first time, your total work is visible to everyone. That visibility alone begins improving the system.
Apply the starting heuristic: WIP limit = team members at that stage × 1.5. Display the limits prominently on the board. Communicate to the team: when a column reaches its limit, do not pull new work — instead, help get existing work moving. The first time the team enforces a WIP limit and refuses to pull a new item, Kanban has begun. It will feel uncomfortable. That discomfort is productive — it surfaces the real conversation about capacity and priorities that was previously invisible.
Record the date each card enters and exits the workflow. Calculate Lead Time for each completed item. Plot the data — even in a simple spreadsheet. Identify your baseline average Lead Time and the spread (some items fast, some very slow). Add an explicit "Blocked" indicator to the board — a red magnet, a red card edge, or a blocked status in your digital tool. Every blocked item should have a named owner for resolution and a target date. The act of naming and tracking blockers triggers faster resolution.
After 4–6 weeks of data, patterns emerge: Which stage has the most ageing items? Where do WIP limits get violated most often? What is the most common cause of blocked items? Use these patterns — not opinions — to select the highest-impact improvement experiment. Run the experiment for 2–4 weeks. Measure whether Lead Time or Throughput improves. Document the result. Implement the Service Delivery Review cadence to make this analysis routine — a monthly conversation about flow metrics, not just a task-level standup.
Once a single team has stable flow metrics and functioning WIP limits, consider expanding. Portfolio Kanban adds a higher-level board where each card represents a project or initiative (rather than an individual task), with WIP limits governing how many projects are in active execution simultaneously. This prevents the common organisational anti-pattern of 20 projects in progress with nothing completing — Little's Law applied at the portfolio level dramatically improves strategic throughput.
The Central Truth of Kanban
Taiichi Ohno observed in 1947 what every experienced project manager eventually discovers: starting more work does not mean finishing more work. In most teams and factories, the bottleneck is not a shortage of work or a shortage of people to start it — the bottleneck is the inability to complete work once started, because too much is in progress simultaneously. Every additional item in progress adds context-switching overhead, increases coordination complexity, and extends the wait time for every other item in the system.
Kanban's answer — made visible on a board, enforced through WIP limits, measured through flow metrics, and improved through cadenced feedback loops — is both ancient and radical: finish what you start before you start something new. Stop starting. Start finishing. Little's Law guarantees that reducing WIP reduces Lead Time, for any stable system, in any industry. The manufacturing engineer who understands this has a tool that works with equal power on a Toyota assembly line or an engineering project office — because workflow is workflow, bottlenecks are bottlenecks, and the mathematics of flow are universal.
1. Visualise everything — including the work you wish you didn't have. Hidden work cannot be managed. Urgent requests, recurring interruptions, and long-running investigations that consume capacity without appearing on any plan must all appear on the board. 2. Enforce WIP limits even when it is uncomfortable. The discomfort of respecting a WIP limit — the conversation about what to deprioritise, what to help finish, what not to start — is the most valuable conversation Kanban creates. Avoiding it defeats the system. 3. Let the data choose the improvement. Flow metrics show you where the real bottleneck is. Intuition usually does not. When the data says the Review stage is the bottleneck and your intuition says Development is too slow, trust the data — then investigate why your intuition was wrong.
Kanban · Taiichi Ohno · Toyota Production System · WIP Limits · Little's Law · Lead Time · Cycle Time · Throughput · David Anderson · Flow Metrics · Pull System · Visual Workflow · Factory to Office · RMG Tech · 2025–2026
About the Author
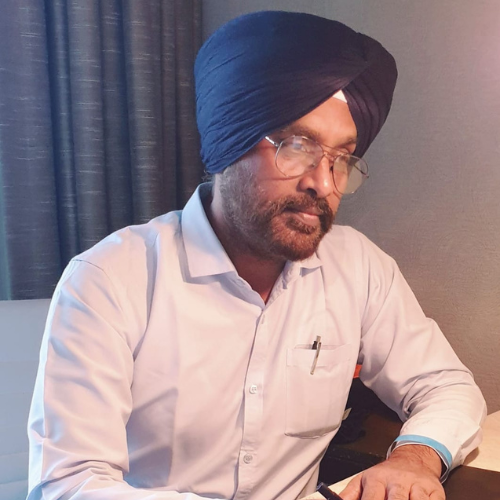
Lean Practitioner & InstructorFounder of RMG TECH and Udemy Instructor. Backed by extensive hands-on experience in industrial environments, including specialized advanced cluster programs in Lean Manufacturing, he specializes in training shop floor teams in 5S, OEE tracking, TPM, and GD&T principles. Through technical articles and digital training, he bridges the gap between engineering theory and practical shop floor execution.