⚡ Lean Manufacturing Training Presentation
Eliminate Waste and Defects Simultaneously for Unmatched Operational Excellence
📊 Lean Six Sigma Training Presentation
What is Lean Six Sigma?
Lean Six Sigma is a powerful hybrid methodology that combines the waste elimination principles of Lean Manufacturing with the variation reduction and quality focus of Six Sigma. This integrated approach delivers faster processes (Lean) with fewer defects (Six Sigma), creating unprecedented improvements in quality, speed, and cost.
By bringing together these two proven methodologies, organizations achieve results neither could deliver alone: dramatically improved quality, significantly reduced cycle times, eliminated waste, and substantial cost savings – all while increasing customer satisfaction.
Understanding Lean Manufacturing
Lean Manufacturing, developed by Toyota as the Toyota Production System (TPS), is a systematic approach to identifying and eliminating waste (non-value-adding activities) through continuous improvement.
Core Principles of Lean
Define value from the customer's perspective. Value is anything the customer is willing to pay for. Everything else is waste.
Map all steps (both value-adding and non-value-adding) required to bring a product from concept to customer. Identify and eliminate waste in the value stream.
Make value-creating steps flow smoothly without interruptions, delays, or bottlenecks. Achieve one-piece flow wherever possible.
Produce only what the customer wants, when they want it, in the quantity they want. Let customer demand "pull" production rather than pushing based on forecasts.
Continuously pursue perfection through endless cycles of improvement. Kaizen (continuous improvement) never stops.
The Eight Wastes of Lean
Lean identifies eight types of waste (often remembered by the acronym DOWNTIME):
| Waste Type | Description | Example |
|---|---|---|
| Defects | Products or services that don't meet requirements | Rework, scrap, warranty claims |
| Overproduction | Producing more than needed or before it's needed | Building inventory ahead of demand |
| Waiting | Idle time when value is not being added | Equipment downtime, approval delays |
| Non-Utilized Talent | Failing to use people's skills and knowledge | Not involving workers in improvement |
| Transportation | Unnecessary movement of products or materials | Moving parts between distant workstations |
| Inventory | Excess products and materials not being processed | Raw materials, WIP, finished goods stock |
| Motion | Unnecessary movement of people | Walking to get tools, reaching, bending |
| Extra Processing | Doing more than customer requires | Over-engineering, excessive reports |
Key Lean Tools
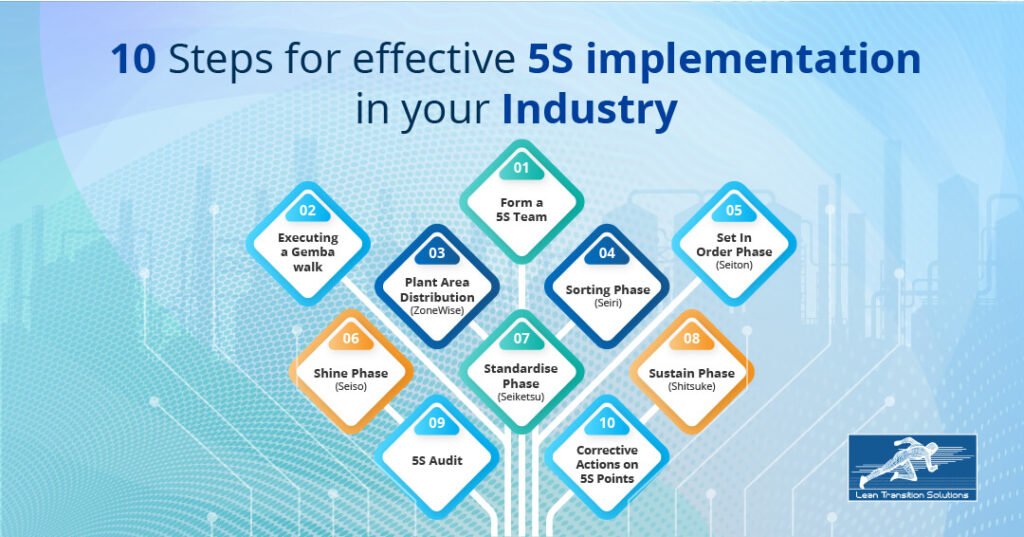
- 5S: Workplace organization and standardization
- Value Stream Mapping: Visualizing process flow and identifying waste
- Kaizen: Continuous improvement events
- Kanban: Visual pull system for inventory management
- SMED: Quick changeover methodology
- TPM: Total Productive Maintenance
- Just-in-Time: Producing only what's needed when needed
- Poka-Yoke: Error-proofing devices and methods
Understanding Six Sigma
Six Sigma, developed by Motorola in the 1980s and popularized by General Electric, is a data-driven methodology focused on reducing process variation and defects to achieve near-perfect quality.
What Does "Six Sigma" Mean?
The term "Six Sigma" refers to a statistical measure of process capability:
Sigma Levels and Defect Rates
| Sigma Level | Defects Per Million Opportunities (DPMO) | Yield | Real-World Example |
|---|---|---|---|
| 2σ | 308,537 | 69.2% | 30 airline bags lost per 100 passengers |
| 3σ | 66,807 | 93.3% | 3 misspelled words per page |
| 4σ | 6,210 | 99.4% | 7 articles lost by airlines daily at O'Hare |
| 5σ | 233 | 99.98% | 1.5 incorrect drug prescriptions per week |
| 6σ | 3.4 | 99.9997% | 1 unsafe minute every 5 months (airline safety) |
Six Sigma represents 3.4 defects per million opportunities – near perfection. Most companies operate at 3-4 sigma (66,807 to 6,210 defects per million), leaving substantial room for improvement.
Core Principles of Six Sigma
Define quality from the customer's perspective. Critical-to-Quality (CTQ) characteristics drive all improvement efforts.
Base decisions on data and statistical analysis, not opinions or assumptions. "In God we trust; all others must bring data."
Understand and manage processes. Problems come from process variation, not people.
Prevent defects rather than detect and correct them. Design quality into products and processes.
Break down barriers between departments. Improvement requires cross-functional teamwork.
Set ambitious goals (perfection) while accepting that improvement involves experimentation and occasional failure.
Statistical Foundation
Six Sigma uses statistical tools to:
- Measure process capability and performance
- Identify sources of variation
- Determine root causes of defects
- Design experiments to test solutions
- Verify improvement sustainability
- Control processes to maintain gains
Key Six Sigma Tools
- Statistical Process Control (SPC): Control charts to monitor process stability
- Measurement System Analysis (MSA): Ensuring measurement reliability
- Process Capability Analysis: Cp, Cpk calculations
- Design of Experiments (DOE): Optimizing multiple variables
- Hypothesis Testing: Validating assumptions with data
- Regression Analysis: Understanding relationships between variables
- Failure Mode & Effects Analysis (FMEA): Proactive risk assessment
Lean vs Six Sigma: Key Differences
While both methodologies aim to improve operations, they have different origins, focus areas, and approaches:
Lean Manufacturing
- Origin: Toyota Production System (Japan, 1950s)
- Primary Focus: Speed and waste elimination
- Core Goal: Maximize customer value with minimum waste
- Key Metric: Cycle time, lead time, inventory turns
- Approach: Flow and pull systems
- Tool Set: Value stream mapping, 5S, Kanban, Kaizen
- Best For: Process speed, reducing waste, improving flow
- Typical Results: 25-50% reduction in cycle time
Six Sigma
- Origin: Motorola (USA, 1980s)
- Primary Focus: Quality and variation reduction
- Core Goal: Near-zero defects (3.4 DPMO)
- Key Metric: Defects per million opportunities (DPMO)
- Approach: Statistical analysis and control
- Tool Set: DMAIC, SPC, DOE, hypothesis testing
- Best For: Quality improvement, reducing variation
- Typical Results: 50-70% reduction in defects
When to Use Lean vs Six Sigma
| Situation | Recommended Approach | Reason |
|---|---|---|
| Problem is clearly visible waste (waiting, motion, transportation) | Lean | Lean tools directly target visible waste |
| Problem involves quality defects or high variation | Six Sigma | Statistical tools needed to understand variation |
| Need quick results with limited data | Lean | Lean improvements can be implemented rapidly |
| Root cause is unknown and complex | Six Sigma | DMAIC provides structured problem-solving |
| Process is slow but produces good quality | Lean | Focus on flow and waste elimination |
| Process is fast but produces poor quality | Six Sigma | Focus on reducing defects and variation |
| Need both speed and quality improvement | Lean Six Sigma | Integrated approach addresses both |
Why Combine Lean & Six Sigma?
While Lean and Six Sigma are powerful individually, combining them creates synergies that deliver superior results:
Complementary Strengths
🎯 Complete Problem-Solving
Lean identifies and eliminates waste; Six Sigma reduces variation and defects. Together they address both speed and quality.
⚡ Faster and Better
Lean makes processes faster; Six Sigma makes them more consistent. Combined result: fast, reliable processes.
📊 Data + Action
Six Sigma provides rigorous analysis; Lean provides practical tools for rapid implementation. Balance analysis with action.
🔄 Short-term + Long-term
Lean delivers quick wins through waste elimination; Six Sigma ensures sustainable, long-term improvements through statistical control.
💡 Culture of Excellence
Lean creates improvement mindset at all levels; Six Sigma builds analytical rigor. Together they create data-driven improvement culture.
💰 Maximum ROI
Addressing both waste (Lean) and variation (Six Sigma) simultaneously yields greater financial returns than either alone.
The Power of Integration
Lean + Six Sigma = Speed + Quality = Customer Delight + Lower Costs
Real-World Evidence
Companies implementing integrated Lean Six Sigma report:
- 40-60% reduction in process cycle time (Lean contribution)
- 50-80% reduction in defects (Six Sigma contribution)
- 15-30% improvement in productivity (combined effect)
- 20-40% reduction in operating costs (combined effect)
- 25-50% improvement in customer satisfaction (combined effect)
Historical Evolution
The integration of Lean and Six Sigma emerged in the late 1990s and early 2000s as practitioners recognized their complementary nature:
- 1990s: Companies using Six Sigma realized they needed speed improvements
- Early 2000s: Organizations practicing Lean recognized the value of statistical rigor
- 2002: George Group publishes first Lean Six Sigma book
- 2005-present: Lean Six Sigma becomes standard approach in many industries
- Today: Most major corporations (GE, Boeing, Amazon, etc.) use integrated Lean Six Sigma
DMAIC: The Lean Six Sigma Roadmap
DMAIC (Define-Measure-Analyze-Improve-Control) is the structured problem-solving framework that drives Lean Six Sigma projects. It integrates Lean and Six Sigma tools at each phase:
Problem, goal, scope
Current performance
Root causes
Implement solutions
Sustain gains
Phase 1: Define
Define the Problem and Project Scope
Objective: Clearly articulate the problem, establish project goals, and gain stakeholder alignment.
Define Phase Activities
- Project Charter: Document problem statement, goals, scope, team, timeline
- Voice of Customer (VOC): Gather customer requirements and CTQ characteristics
- SIPOC Diagram: Map high-level process (Suppliers-Inputs-Process-Outputs-Customers)
- Stakeholder Analysis: Identify who's affected and how to engage them
- Business Case: Quantify financial impact and justify resources
Deliverables: Project charter, SIPOC, high-level process map, team formation
Phase 2: Measure
Measure Current Performance
Objective: Establish baseline performance, validate measurement systems, and quantify the problem.
Measure Phase Activities
- Detailed Process Mapping: Document current state in detail (value stream map, swimlane diagram)
- Data Collection Plan: Determine what to measure, how, when, and who
- Measurement System Analysis (MSA): Verify measurement accuracy and precision
- Baseline Metrics: Calculate current sigma level, DPMO, cycle time, waste
- Process Capability: Determine Cp, Cpk to understand variation
Key Lean Tool: Value stream mapping to identify waste and non-value-added time
Key Six Sigma Tool: Statistical analysis to understand process capability
Phase 3: Analyze
Analyze Root Causes
Objective: Identify and verify root causes of defects, delays, and waste.
Analyze Phase Activities
- Data Analysis: Graphs, charts, Pareto analysis to understand patterns
- Root Cause Analysis: 5 Whys, fishbone diagrams, fault tree analysis
- Hypothesis Testing: Statistical tests to validate or refute theories
- Waste Analysis: Categorize and quantify the eight wastes
- Bottleneck Analysis: Identify constraints limiting flow
- Regression Analysis: Understand relationships between variables
Goal: Move from symptoms to validated root causes with data proof
Phase 4: Improve
Implement Solutions
Objective: Design, test, and implement solutions that address root causes.
Improve Phase Activities
- Generate Solutions: Brainstorming, best practices, benchmarking
- Solution Selection: Impact/effort matrix, Pugh matrix to prioritize
- Pilot Testing: Small-scale trials to validate effectiveness
- Design of Experiments (DOE): Optimize multiple variables simultaneously
- Lean Implementation: 5S, SMED, Kanban, error-proofing
- Mistake-Proofing: Poka-yoke devices to prevent defects
- Standard Work: Document new processes and procedures
Result: Proven solutions ready for full implementation
Phase 5: Control
Control and Sustain Improvements
Objective: Ensure improvements are sustained and continue to deliver results.
Control Phase Activities
- Control Plan: Document how to monitor and maintain new process
- Statistical Process Control (SPC): Control charts to track performance
- Visual Management: Dashboards, scorecards to make performance visible
- Training: Ensure all stakeholders understand new processes
- Documentation: Update procedures, work instructions, training materials
- Audits: Regular checks to verify compliance with standards
- Handoff: Transfer ownership from project team to process owners
Success Criteria: Improvements sustained for 6+ months with statistical proof
Lean Six Sigma Tool Kit
Lean Six Sigma practitioners have access to a comprehensive toolkit combining the best of both methodologies:
Integrated Tool Set by DMAIC Phase
| DMAIC Phase | Lean Tools | Six Sigma Tools |
|---|---|---|
| Define | SIPOC, Voice of Customer, Project Charter | CTQ Tree, Kano Model, QFD |
| Measure | Value Stream Mapping, Takt Time, Process Observations | MSA, Process Capability (Cp/Cpk), Data Collection Plans |
| Analyze | 5 Whys, Spaghetti Diagrams, Waste Analysis | Hypothesis Testing, Regression, ANOVA, Correlation |
| Improve | Kaizen, 5S, SMED, Kanban, Poka-Yoke | Design of Experiments (DOE), FMEA, Simulation |
| Control | Visual Management, Standard Work, Audits | Control Charts (SPC), Process Control Plans |
Universal Tools (Used Throughout)
- Brainstorming: Generate ideas and solutions
- Affinity Diagrams: Organize ideas into themes
- Fishbone Diagram (Ishikawa): Identify potential causes
- Pareto Charts: Prioritize based on 80/20 rule
- Flowcharts: Map processes
- Scatter Plots: Visualize relationships
- Run Charts: Track performance over time
- Histograms: Show distribution of data
Tool Selection Guidelines
Choose tools based on:
- Problem Type: Quality issue? Use Six Sigma statistical tools. Waste issue? Use Lean flow analysis.
- Data Availability: Rich historical data? Statistical analysis. Limited data? Lean observations.
- Complexity: Simple, visible problem? Lean tools. Complex, unknown causes? Six Sigma analysis.
- Speed Required: Need quick action? Lean. Need thorough analysis? Six Sigma.
- Team Capability: Match tools to team's statistical knowledge and training
Benefits of Lean Six Sigma Integration
Organizations that successfully implement integrated Lean Six Sigma experience transformative improvements across all dimensions of performance:
Financial Benefits
💰 Cost Reduction
Typical savings of 15-30% in operating costs through waste elimination and defect reduction. Projects averaging $100K-$500K in annual savings.
📈 Revenue Growth
Improved quality and faster delivery increase customer satisfaction, leading to higher sales, repeat business, and market share gains.
⚡ Working Capital
Reduced inventory (Lean) and fewer defects (Six Sigma) free up cash tied in WIP and finished goods. Typical 20-40% inventory reduction.
🎯 ROI Excellence
Lean Six Sigma projects typically deliver 5:1 to 10:1 ROI within first year. Belt training investment recovered through project savings.
Operational Benefits
🚀 Faster Processes
40-60% reduction in cycle time through Lean flow improvements. Get products to market faster, respond to customers quicker.
✨ Superior Quality
50-80% reduction in defects through Six Sigma variation reduction. Achieve 4-5 sigma levels (99%+ quality) consistently.
⚙️ Process Stability
Statistical process control (Six Sigma) + standardized work (Lean) create predictable, reliable processes that stay in control.
📊 Better Decisions
Data-driven culture replaces opinion-based decisions. Teams use facts and analysis to solve problems and make improvements.
Strategic Benefits
- Competitive Advantage: Faster, better, cheaper operations create sustainable differentiation
- Customer Loyalty: Consistently meeting/exceeding expectations builds long-term relationships
- Agility: Streamlined processes enable faster response to market changes
- Innovation Platform: Continuous improvement culture supports innovation
- Scalability: Standardized, capable processes scale more easily
- Risk Reduction: Lower variation and better controls reduce operational risks
Cultural Benefits
- Employee Engagement: Involvement in improvement increases satisfaction and retention
- Problem-Solving Skills: Workforce develops analytical and improvement capabilities
- Cross-Functional Collaboration: Breaking down silos to improve processes
- Ownership Mindset: People take responsibility for process performance
- Learning Organization: Continuous experimentation and improvement becomes the norm
Lean Six Sigma Implementation Strategy
Successful Lean Six Sigma deployment requires careful planning and systematic execution:
Phase 1: Foundation (Months 1-3)
Leadership Commitment
Secure executive sponsorship and resources. Leaders must understand Lean Six Sigma, believe in its potential, and commit to active participation.
Strategic Alignment
Link Lean Six Sigma to business strategy. Identify which strategic objectives will be supported through improvement projects.
Infrastructure Development
Establish governance structure (steering committee, champions). Define roles, responsibilities, project selection criteria, and review processes.
Initial Training
Train champions and select/train first wave of Black Belts. Champions receive 2-3 days of awareness training; Black Belts receive 4-6 weeks of training.
Phase 2: Pilot Projects (Months 4-8)
Project Selection
Choose 3-5 high-impact, achievable projects for initial wave. Projects should have clear business impact and reasonable chance of success.
Project Execution
Black Belts lead projects using DMAIC methodology. Conduct regular tollgate reviews (at each DMAIC phase) to ensure progress and rigor.
Communication
Share project progress, successes, and learnings throughout organization. Build awareness and momentum through visible results.
Phase 3: Expansion (Months 9-18)
Scale Training
Train additional Black Belts and first wave of Green Belts. Green Belts receive 2-3 weeks of training focused on core tools.
Broaden Deployment
Expand to additional departments and functions. Maintain project pipeline to keep belts productive and build momentum.
System Integration
Integrate Lean Six Sigma with other business systems (strategy deployment, performance management, budgeting).
Phase 4: Institutionalization (Months 18+)
Cultural Embedding
Make Lean Six Sigma "how we work" rather than a program. Include in job descriptions, performance reviews, and promotion criteria.
Yellow Belt Training
Train frontline employees in basic tools and improvement methods. Create organization-wide awareness and capability.
Continuous Improvement
Evolve deployment based on lessons learned. Measure deployment effectiveness and make adjustments. Sustain momentum over long term.
- Visible, active leadership engagement (not delegation)
- Rigorous project selection linked to strategy
- High-quality training with real projects
- Adequate resources (belt time, project support)
- Discipline in DMAIC methodology and tollgates
- Recognition and celebration of results
- Long-term commitment (3-5 years minimum)
The Belt System: Roles and Responsibilities
Lean Six Sigma uses a martial arts belt system to designate levels of expertise and responsibility:
Belt Levels Comparison
| Belt Level | Training | Role | Time Commitment | Project Scope |
|---|---|---|---|---|
| Champion | 2-3 days | Executive sponsor, remove barriers | 5-10% time | Portfolio oversight |
| Master Black Belt | MBB certification + experience | Coach belts, deploy program, advanced statistics | 100% dedicated | Organization-wide |
| Black Belt | 4-6 weeks (160 hours) | Lead complex projects, mentor Green Belts | 100% dedicated or 50%+ time | Cross-functional, high impact ($100K+ savings) |
| Green Belt | 2-3 weeks (80 hours) | Lead department projects, team member on BB projects | 25-50% time | Departmental ($25K-$100K savings) |
| Yellow Belt | 1-3 days (8-24 hours) | Team member, basic improvement tools | Part-time as needed | Work area improvements |
| White Belt | 4-8 hours | Awareness, support projects | Minimal | N/A |
Detailed Role Descriptions
- Set strategic direction for Lean Six Sigma deployment
- Allocate resources and remove organizational barriers
- Select and prioritize high-impact projects
- Participate in project reviews and tollgates
- Recognize and reward belt achievements
- Model data-driven decision making
- Coach and mentor Black Belts and Green Belts
- Provide advanced statistical consulting
- Develop and deliver training programs
- Guide deployment strategy and infrastructure
- Validate project results and methodology rigor
- Research and introduce advanced tools
- Typical experience: 5+ years as Black Belt, 10+ successful projects
- Lead 4-6 major improvement projects per year
- Apply full DMAIC methodology with statistical rigor
- Mentor Green Belts on their projects
- Facilitate cross-functional project teams
- Drive cultural change in their area
- Typical background: Technical or analytical role with 3+ years experience
- Success metrics: Projects completed, $ saved, cycle time improvements
- Lead 2-4 departmental projects per year
- Apply DMAIC with core statistical tools
- Serve as team member on Black Belt projects
- Implement improvements in their functional area
- Balance project work with regular job responsibilities (often 25-50% time on projects)
- Typical background: Functional expert, supervisor, or technical specialist
- Understand Lean Six Sigma basics and terminology
- Participate effectively as team member on projects
- Apply basic improvement tools in daily work
- Support data collection and small improvements
- Contribute to kaizen events and improvement activities
- Build improvement mindset across organization
Building Your Belt Structure
General guidelines for belt population in an organization:
- Black Belts: 1-2% of employee population (e.g., 10-20 BBs per 1000 employees)
- Green Belts: 5-10% of employee population
- Yellow Belts: 30-50% of employee population
- Master Black Belts: 1 MBB per 10-20 Black Belts
Real-World Lean Six Sigma Success Stories
Case Study 1: Manufacturing - Automotive Supplier
Challenge
High defect rates (5,000 DPMO) causing customer complaints and warranty costs. Long cycle times (48 hours) delaying shipments and requiring excess inventory.
Lean Six Sigma Approach
- Define: Target: Reduce defects to <500 DPMO, reduce cycle time to 24 hours
- Measure: Value stream mapped entire process, identified 60% non-value-added time. Measured capability at 2.8 sigma.
- Analyze: DOE identified critical process parameters. Found variation from inconsistent setup procedures.
- Improve: Implemented SMED to reduce setup time, mistake-proofing devices, standardized work instructions, cellular manufacturing layout.
- Control: Statistical process control charts, visual management boards, daily team huddles.
Results (6 months)
- Defects reduced from 5,000 to 400 DPMO (92% improvement) – achieved 4.5 sigma
- Cycle time reduced from 48 to 20 hours (58% improvement)
- Inventory reduced by 40% ($2M cash freed)
- Customer complaints reduced by 85%
- Annual savings: $3.2M
Case Study 2: Healthcare - Hospital Emergency Department
Challenge
Patient wait times averaging 4.5 hours, causing patient dissatisfaction and LWBS (left without being seen) rate of 8%.
Lean Six Sigma Approach
- Define: Target: Reduce average wait time to <2 hours, reduce LWBS to <2%
- Measure: Mapped patient flow, identified bottlenecks in triage and lab results. Collected data on 2,000+ patient visits.
- Analyze: Found variation in triage process, delays waiting for lab results, unbalanced workload. Regression identified key predictors of long waits.
- Improve: Implemented fast-track for low-acuity patients, point-of-care testing, standardized triage, visual queue management, adjusted staffing to demand patterns.
- Control: Real-time dashboard showing wait times, daily huddles to address issues, monthly audits of standard work.
Results (9 months)
- Average wait time reduced from 4.5 to 1.8 hours (60% improvement)
- LWBS rate reduced from 8% to 1.5%
- Patient satisfaction scores increased from 68% to 89%
- Treated 15% more patients with same resources (better flow)
- Staff satisfaction improved (less chaos, clearer processes)
Case Study 3: Financial Services - Loan Processing
Challenge
Loan application processing taking 15 days on average with 12% error rate requiring rework. Losing customers to faster competitors.
Lean Six Sigma Approach
- Define: Target: Reduce processing time to 5 days, reduce errors to <3%
- Measure: Mapped process - 23 steps, 78% non-value-added time. Data showed high variation (3-30 day range).
- Analyze: Found unnecessary handoffs, waiting for signatures, manual data entry errors, redundant verification steps. Process capability only 2.3 sigma.
- Improve: Eliminated 8 non-value steps, implemented electronic signatures, automated data validation, cross-trained staff, created standard work.
- Control: Dashboard tracking cycle time and errors, weekly reviews, process owner assigned.
Results (4 months)
- Processing time reduced from 15 to 4.5 days (70% improvement)
- Error rate reduced from 12% to 2.5% (79% improvement)
- Customer satisfaction increased from 72% to 91%
- Capacity increased by 40% (same headcount processing more loans)
- Competitive wins increased 25%
Common Lean Six Sigma Challenges
Challenge 1: Lack of Leadership Commitment
Symptoms: Leaders don't attend reviews, resources not allocated, projects not prioritized, belts pulled for other work.
Root Cause: Leadership views Lean Six Sigma as "nice to have" rather than strategic imperative.
Solution:
- Link projects directly to business strategy and objectives
- Show financial impact early with pilot project results
- Make Lean Six Sigma part of leadership performance metrics
- Require executive participation in tollgate reviews
- Share competitive data showing Lean Six Sigma as competitive necessity
Challenge 2: Poor Project Selection
Symptoms: Projects don't deliver results, take too long, scope creeps, belts get frustrated.
Root Cause: Choosing projects based on politics, pet issues, or convenience rather than impact and feasibility.
Solution:
- Establish clear project selection criteria (strategic alignment, impact, feasibility)
- Use portfolio approach balancing quick wins and strategic initiatives
- Properly scope projects (not too broad, not too narrow)
- Vet projects through steering committee before approval
- Have MBBs assess technical feasibility
Challenge 3: Inadequate Training
Symptoms: Belts struggle with tools, don't follow DMAIC rigor, analysis is superficial.
Root Cause: Training too theoretical, doesn't connect to real work, insufficient practice.
Solution:
- Integrate training with real projects (learn while doing)
- Use organization's actual data and processes in training examples
- Provide coaching and mentoring during project execution
- Customize training to organization's industry and issues
- Ensure trainers have real-world belt experience, not just academic knowledge
Challenge 4: Analysis Paralysis
Symptoms: Projects take 12+ months, teams stuck in analysis, never get to implementation.
Root Cause: Over-emphasis on Six Sigma statistical analysis without Lean action bias.
Solution:
- Balance analysis with action using Lean principles
- Set time limits for each DMAIC phase (e.g., 4-6 months total)
- Use "good enough" analysis rather than perfect analysis
- Implement quick wins during analysis phase
- Remember: some action with imperfect knowledge beats perfect knowledge with no action
Challenge 5: Failure to Sustain Results
Symptoms: Performance reverts to baseline after 6-12 months, controls not maintained.
Root Cause: Weak control phase, no ownership transfer, competing priorities.
Solution:
- Require rigorous control plans before project closure
- Assign process owners responsible for ongoing performance
- Audit projects 6-12 months after completion
- Build controls into daily management systems
- Link process performance to process owner's performance review
Keys to Lean Six Sigma Success
1. Strategic Alignment
Projects must support business strategy. Link every project to strategic objectives. Projects should solve real business problems, not be academic exercises.
2. Leadership Engagement
Active participation, not delegation. Leaders attend reviews, ask tough questions, remove barriers, and visibly support deployment.
3. Right People as Belts
Select high-performers with credibility, analytical skills, and influence. Belt training is development opportunity for future leaders.
4. Quality Training
Rigorous, practical training integrated with real projects. Use experienced MBBs as trainers, not just consultants.
5. Project Discipline
Follow DMAIC methodology rigorously. Conduct tollgate reviews at each phase. Don't skip steps or cut corners.
6. Adequate Resources
Protect belt time for projects. Provide budget for data collection, piloting, implementation. Don't expect results without investment.
7. Communication
Share progress, successes, and learnings. Build awareness and momentum. Make results visible throughout organization.
8. Recognition
Celebrate project completions and results. Recognize belt achievements publicly. Link advancement to Lean Six Sigma expertise.
9. Integration
Embed Lean Six Sigma in business systems - strategy deployment, budgeting, performance management. Make it how business operates.
10. Long-term Commitment
Plan 3-5 year deployment, not 1-year program. Build capability systematically. Don't abandon when leadership changes.
11. Balance Lean & Six Sigma
Use both methodologies appropriately. Don't become dogmatic about one approach. Match tools to problem type.
12. Continuous Evolution
Learn and improve deployment based on results. Benchmark best practices. Adapt to changing business needs.
Conclusion: The Lean Six Sigma Journey
Lean Six Sigma represents the synthesis of two powerful improvement methodologies, combining Lean's waste elimination focus with Six Sigma's variation reduction rigor. Together, they create a comprehensive approach to operational excellence.
Key Takeaways
Lean and Six Sigma aren't competing methodologies – they're complementary. Lean addresses speed and waste; Six Sigma addresses quality and variation. Organizations need both.
Lean Six Sigma builds a culture where decisions are based on facts and data, not opinions or gut feel. This cultural shift may be more valuable than any single project.
DMAIC provides a disciplined approach to solving complex problems. It prevents jumping to solutions before understanding root causes.
The belt system develops problem-solving capability throughout the organization. This capability becomes a sustainable competitive advantage.
Properly deployed Lean Six Sigma delivers measurable financial results – millions in cost savings and revenue growth for medium-large organizations.
Lean Six Sigma isn't a quick fix or flavor-of-the-month program. Realizing full benefits requires 3-5 years of sustained effort.
Your Next Steps
- Assess Readiness: Evaluate your organization's culture, leadership commitment, and strategic priorities
- Educate Leadership: Ensure executives understand Lean Six Sigma value and their role
- Build Business Case: Quantify potential benefits specific to your organization
- Develop Deployment Plan: 3-5 year roadmap for training, projects, and capability building
- Select Initial Belts: Choose high-performers with credibility and analytical skills
- Identify Pilot Projects: High-impact projects with reasonable success probability
- Secure Resources: Budget for training, belt time, and project implementation
- Launch and Learn: Start deployment, measure results, adjust approach based on learnings
The Path Forward
In an increasingly competitive global economy, organizations must continually improve to survive and thrive. Lean Six Sigma provides a proven framework for achieving operational excellence through:
- Eliminating waste that adds cost without adding value
- Reducing variation that creates defects and unpredictability
- Improving quality that delights customers and reduces costs
- Accelerating processes to respond faster to market demands
- Building capability to solve increasingly complex problems
Organizations that master Lean Six Sigma don't just get better processes – they build improvement DNA into their culture. Problem-solving becomes second nature. Data-driven decisions become the norm. Waste and variation become intolerable.
This cultural transformation creates a widening gap between Lean Six Sigma practitioners and competitors. While competitors fight the same old problems year after year, Lean Six Sigma organizations systematically eliminate problems and build capability.
The question isn't whether to pursue Lean Six Sigma – it's whether you can afford not to. In markets where competitors are deploying Lean Six Sigma, standing still means falling behind.
Your journey to operational excellence begins with a commitment to combine the best of Lean and Six Sigma. Are you ready to begin?
Ready to Transform Your Operations?
Download our comprehensive Lean Six Sigma starter kit including project charter templates, DMAIC checklists, training materials, and implementation roadmap.
Download Free LSS Toolkit