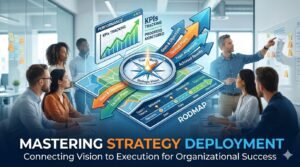
Mastering Strategy Deployment
A comprehensive guide to Strategy Deployment — the Hoshin Kanri methodology that cascades organisational vision into daily action through the X-Matrix, Catchball process, and rigorous review cycles, ensuring every person's work connects directly to long-term breakthrough goals.
What is Strategy Deployment?
Strategy Deployment — also known as Hoshin Kanri, Policy Deployment, or Hoshin Planning — is a systematic management methodology that translates an organisation's long-term vision and breakthrough objectives into focused annual priorities, specific improvement initiatives, and measurable outcomes at every level of the organisation. It is not strategic planning. It is strategic execution — the disciplined system that ensures what is decided in the boardroom actually happens on the shop floor, in the lab, and in the office.
Strategy Deployment is the management process that aligns the entire organisation — from senior leadership to front-line teams — around a small number of critical breakthrough objectives, deploying those objectives as a coherent cascade of annual goals, improvement priorities, and accountable actions, and reviewing progress through structured PDCA cycles at every level.
The words Hoshin Kanri (方針管理) translate roughly as "direction management" or "compass management" — managing the organisation's compass heading so every part of it is pointing the same way. The tool at the centre of Hoshin Kanri is the X-Matrix, a single sheet of paper that captures the entire strategic planning architecture — breakthrough objectives, annual goals, improvement initiatives, metrics, and accountability — on one visible A3 document.
Hoshin Kanri is the management system that allows an organisation to focus on a few critical objectives, align all departments and levels around those objectives, and sustain the improvement over time. Without it, every function optimises itself — and the organisation as a whole drifts.
— Thomas Jackson, Hoshin Kanri for the Lean EnterpriseHistory & Origins of Hoshin Kanri
Strategy Deployment was developed in Japan during the 1960s as Japanese manufacturers recognised that the quality and productivity tools they were deploying at the process level — PDCA, SPC, QC circles — were not being strategically directed toward the organisation's most important goals. Tools were being used everywhere, but the organisation was not improving in the right direction.
Bridgestone Tire became the first company to formally deploy Hoshin Kanri, winning the prestigious Deming Prize in 1968 after demonstrating measurable alignment between executive strategy and shop-floor improvement activities. Toyota simultaneously developed its own version as an extension of the Toyota Production System — ensuring that kaizen activities were aligned with strategic priorities, not scattered across random improvement opportunities.
The Union of Japanese Scientists and Engineers (JUSE) formalised Hoshin Kanri as a discipline and incorporated it into the Deming Prize assessment criteria. During Japan's industrial expansion, Hoshin Kanri became the standard management system for Japan's leading manufacturers — linking annual business plans directly to the long-term vision of the company.
Hewlett-Packard was among the first Western companies to adopt Hoshin Kanri, calling it "Hoshin Planning" and deploying it globally across all business units. Intel, Procter & Gamble, and other Fortune 500 companies followed. The 1989 book by Yoji Akao, Hoshin Kanri: Policy Deployment for Successful TQM, became the definitive English-language reference.
Strategy Deployment became a core pillar of Lean Management Systems alongside Daily Management and Problem Solving. Authors such as Thomas Jackson, Pascal Dennis, and the Lean Enterprise Institute formalised the X-Matrix format and Catchball process. Modern adaptations integrate Hoshin Kanri with OKRs (Objectives and Key Results), Agile portfolio planning, and Toyota Kata coaching cycles.
The Hoshin Kanri System
Hoshin Kanri is not a single tool — it is a complete management system with five interconnected components that work together to create strategic alignment from the boardroom to the front line. Understanding all five components is essential: organisations that deploy only the X-Matrix without the Catchball process, or that plan without rigorous review cycles, consistently fail to achieve the breakthrough results Hoshin Kanri promises.
The 5–10 year ideal future state — the organisation's purpose and long-term direction. Sets the compass heading for all subsequent planning. Rarely changes. Inspires rather than instructs.
3–5 strategic challenges that represent significant, step-change improvement over 3–5 years. These are not incremental goals — they require fundamentally different approaches and cross-functional collaboration to achieve.
The specific measurable milestones to achieve this year on the path to the breakthrough goals. Typically 3–5 annual objectives, each with a clear numeric target, baseline, and owner.
The specific Kaizen events, A3 projects, and cross-functional initiatives that will deliver the annual objectives. Each priority links explicitly to one or more annual objectives in the X-Matrix.
Leading and lagging metrics that measure progress against each priority and annual objective. Reviewed monthly at the business level and quarterly at the executive level through structured PDCA review meetings.
These five levels form a cascade — Vision → Breakthrough → Annual → Priorities → Metrics — with each level translating the level above into more specific, actionable, and measurable terms. The cascade is created through Catchball (see Section 05) — the iterative negotiation between levels that ensures alignment and realistic commitment, rather than top-down mandate.
The X-Matrix Explained
The X-Matrix is the single most important tool in Hoshin Kanri — a one-page visual management tool that captures the entire strategic planning architecture of an organisation (or a business unit) in a format that shows not just the goals, but the relationships between goals. It is called the X-Matrix because the four planning elements are arranged in quadrants around a central diamond, forming an X shape, with correlation indicators marked at the intersections between adjacent quadrants.
The long-term strategic goals — the step-change improvements the organisation needs to achieve over the next 3–5 years to fulfil its vision. Typically 3–5 statements. These are directional and ambitious — they describe where the organisation must get to, not how. Examples: "Achieve 85% OEE across all production lines" or "Reduce total customer lead time by 60%."
The leading and lagging performance indicators that measure whether the improvement priorities are delivering the expected annual results. Each metric links to one or more priorities and annual objectives. The East quadrant tracks how we will know if we are succeeding — not the targets themselves, but the measurement system that makes progress or failure visible.
The specific measurable milestones to be achieved this year — the annual stepping stones toward the 3–5 year breakthrough goals. Each annual objective has a clear numeric target (from X to Y by date Z), a defined baseline, and a named owner. Typically 3–5 annual objectives, each correlated to one or more breakthrough objectives in the North quadrant.
The specific projects, Kaizen events, A3 initiatives, and cross-functional improvement activities that will deliver the annual objectives. Each priority is correlated to the annual objectives it supports (West) and the metrics it will move (East). The accountability ring (far South) assigns a named owner to every priority — making accountability explicit and visible on a single page.
The power of the X-Matrix is not in any single quadrant — it is in the correlation diamonds at every intersection. When a strong correlation (●) or supporting correlation (○) is marked between a priority and an annual objective, it creates an explicit, visible, and challengeable claim: "This initiative will move this annual goal toward this breakthrough objective." If a priority has no strong correlations in the matrix, it should be questioned — it is consuming resources without a strategic link. If an annual objective has no priorities correlated to it, it will not be achieved — it has no execution mechanism.
The Catchball Process
Catchball is the iterative, multi-directional communication process through which Hoshin objectives and targets are negotiated between management levels — rather than simply mandated top-down. The name comes from the image of throwing and catching a ball: senior leadership throws the strategic direction downward; the receiving level catches it, studies it, challenges it, enriches it with operational knowledge, and throws it back up with their proposed targets and resource requirements before a final agreement is reached.
Senior leadership articulates the Breakthrough Objectives and Annual Objectives — the strategic direction and the performance gap to be closed. These are shared with the next level of management not as fixed mandates, but as a starting point for dialogue. The question asked is: "Given this direction and this gap, what do you believe we should prioritise, and what can you commit to achieving this year?"
The receiving level analyses the strategic intent against their operational reality — current performance, resource constraints, capability gaps, and known improvement opportunities. They develop their proposed priorities and committed targets, explaining which initiatives they believe will close the gap and what support they require. This response is thrown back up to senior leadership — not as a negotiation to reduce targets, but as a grounded, informed commitment.
The Catchball continues — typically 2–4 rounds — until both levels genuinely agree on the targets, priorities, and required support. The result is mutual accountability: leadership commits to providing the resources and removing the barriers; the department commits to delivering the agreed results. This mutual accountability is what distinguishes Hoshin Kanri from traditional top-down target-setting — and it is what makes the annual review conversation honest rather than defensive.
The completed Catchball outputs are captured in the department-level X-Matrix — a sub-matrix that shows how the department's improvement priorities align to the business-level annual objectives, creating a visible line of sight from every team's daily work to the organisation's 3–5 year breakthrough goals.
Building the X-Matrix — Step by Step
Constructing a valid X-Matrix is a facilitated leadership team exercise, typically taking 1–2 days for the first iteration and refining over several Catchball rounds. The sequence matters — each quadrant must be completed before the next, and the correlations between quadrants must be challenged rigorously.
Begin with the 3–5 year breakthrough challenges — the strategic gaps between current and desired performance that require fundamental change, not incremental improvement. Use the "What must be true in 3–5 years for us to have fulfilled our vision?" question. Keep to a maximum of 5. If you cannot identify your top 3–5 strategic challenges with clarity, the strategic context is not yet ready for X-Matrix deployment.
For each breakthrough objective, define the specific measurable milestone to achieve this year — expressed as a SMART target: from [baseline] to [target] by [date]. Mark strong (●) and supporting (○) correlations between each annual objective and the breakthrough objective(s) it advances. Challenge every annual objective that has no strong correlation to a breakthrough — why is it on the X-Matrix?
Identify the specific improvement initiatives, A3 projects, and Kaizen activities that will close the gap between current performance and the annual objectives. Assign a single named owner to every priority in the accountability ring. Mark correlations between each priority and the annual objectives it supports. Eliminate any priority that has no strong correlation — it is consuming resources without strategic link.
For each improvement priority, define the leading indicator (process metric — tells you if the work is happening) and lagging indicator (result metric — tells you if the outcome is being achieved). Mark correlations between priorities and their metrics. The East quadrant creates the measurement architecture for the monthly review process — without it, reviews become discussions rather than data-driven decisions.
Review the completed X-Matrix as a system: Are there annual objectives with no priorities? (Gap in execution plan.) Are there priorities with no annual objective correlations? (Eliminate or re-examine.) Do the metrics actually measure what the priorities are trying to achieve? Then deploy through Catchball — share with department heads, receive their proposed sub-matrices, and iterate until alignment is genuine.
A3 Thinking & Strategy Deployment
The A3 Report — named for the A3 (297×420mm) paper size on which it is written — is the problem-solving and planning document that bridges the X-Matrix strategic layer with the execution layer. Every improvement priority in the South quadrant of the X-Matrix should have a corresponding A3 that describes the problem, the current condition, the target condition, the root cause analysis, the countermeasures, and the plan — all on a single, visible page.
Why this priority matters — the strategic context, the performance gap it addresses, and the link to the X-Matrix annual objective. Makes the "why" explicit and prevents drift.
Data-driven description of the current state — what is actually happening, what the baseline measures are, and where the specific problems exist. Uses process maps, run charts, and Pareto analysis.
The specific, measurable desired future state — what the process should look like when the initiative succeeds. Aligned directly to the annual objective target in the X-Matrix West quadrant.
5-Why analysis or Fishbone diagram identifying the root causes of the performance gap. Ensures countermeasures address root causes rather than symptoms — preventing recurrence.
The specific actions to address each root cause — with owner, due date, and expected contribution to the target. Prioritised by impact and resource requirement.
Gantt or milestone plan showing when countermeasures will be implemented, who will verify them, and when progress reviews will occur — connected to the monthly X-Matrix review cadence.
The A3 serves a second critical function beyond planning — it is the coaching document for Hoshin Kanri leaders. When senior leaders review progress during monthly or quarterly sessions, they review the A3s for each priority: Is the current condition accurately understood? Is the root cause analysis rigorous? Are the countermeasures addressing root causes? This review turns monthly meetings from status reports into genuine improvement coaching — the same coaching pattern used in Toyota Kata.
Review Cadence & PDCA Rhythm
Strategy Deployment without a disciplined review cadence is merely strategic planning — a document exercise that produces no change. The review system is what makes Hoshin Kanri a living management process rather than an annual planning ritual. Reviews follow a structured PDCA (Plan-Do-Check-Act) rhythm at multiple time horizons simultaneously.
| Review Tier | Frequency | Participants | Focus | Output |
|---|---|---|---|---|
| Tier 1 — Daily | Daily (15 min) | Team / Cell level | Yesterday vs plan · Immediate countermeasures | Same-day action |
| Tier 2 — Weekly | Weekly (30 min) | Value Stream / Dept | KPI trends · Obstacle escalation · A3 progress | Obstacle removal |
| Tier 3 — Monthly | Monthly (2 hrs) | Business Unit leadership | X-Matrix KPI review · A3 coaching · Resource decisions | Course corrections |
| Tier 4 — Quarterly | Quarterly (half day) | Senior leadership team | Annual objective progress · Breakthrough tracking · Portfolio rebalance | Strategy adjustments |
| Tier 5 — Annual | Annual (1–2 days) | Full leadership team | Year-end reflection · Lessons learned · New X-Matrix for next year | New annual plan
The monthly Tier 3 review is the heartbeat of Strategy Deployment. It follows a structured format: each priority owner presents their A3 — showing the current condition (with data), progress against the target condition, obstacles encountered, and countermeasures taken. The senior leader's role in this review is not to evaluate the person, but to improve the thinking — asking Catchball-style questions: "What is the actual current condition? What obstacle are you addressing? What did you expect, and what actually happened?" This transforms the monthly review from a reporting ritual into an organisational learning process.
Strategy Deployment vs MBO & Other Frameworks
Strategy Deployment is frequently compared with Management by Objectives (MBO), Balanced Scorecard, and OKRs (Objectives and Key Results). Understanding the differences is critical for organisations choosing a strategic management system and for those integrating multiple frameworks.
| Dimension | Hoshin Kanri / X-Matrix | MBO (Drucker) | OKR (Intel/Google) |
|---|---|---|---|
| Focus | 3–5 breakthrough challenges + annual deployment | Individual performance objectives | Ambitious quarterly/annual stretch goals |
| Alignment Mechanism | Catchball — bilateral negotiation | Top-down mandate or bilateral review | Transparent public alignment (OKR trees) |
| Depth of Planning | Root cause → countermeasures → A3 | Goal + measurement only | Objective + 3–5 Key Results only |
| Review Cadence | Daily/Weekly/Monthly/Quarterly/Annual | Annual (mid-year check) | Weekly check-in + quarterly review |
| Improvement Method | A3 / PDCA / Kaizen built in | Not specified | Not specified |
| Ideal Context | Lean manufacturing, process excellence | Traditional management, professional services | High-growth tech, knowledge work |
| Key Strength | Vertical alignment + execution discipline | Simplicity, individual accountability | Ambition, transparency, agility |
Many leading organisations now deploy hybrid systems — using Hoshin Kanri's X-Matrix and Catchball for operational breakthrough planning alongside OKRs for team-level quarterly agility. The key insight is that these frameworks are complementary: Hoshin Kanri provides the strategic architecture and execution discipline that OKRs lack; OKRs provide the transparency and quarterly agility that traditional Hoshin implementations sometimes lack.
Industry Applications & Benefits
Strategy Deployment has been successfully applied across industries where complex organisations need to align large workforces around a small number of critical priorities — and where execution, not just planning, is the bottleneck.
Toyota, Honda, and their global supply chains use Hoshin Kanri to cascade annual quality, cost, and delivery targets through every tier of the organisation — from corporate strategy to cell-level daily management.
Hospital systems use Strategy Deployment to align clinical quality, patient safety, and operational efficiency goals across complex multi-site, multi-specialty organisations where top-down mandates consistently fail.
Intel pioneered Western adoption of Hoshin Kanri. Technology companies use it to align R&D, operations, and commercial functions around product breakthrough goals — preventing the functional silos that destroy speed.
Complex programmes with long delivery cycles and strict quality requirements benefit from Hoshin's structured cascade — ensuring every work package connects to system-level performance targets.
Any manufacturer pursuing OEE improvement, quality certification, or supply chain transformation uses Hoshin Kanri to ensure all improvement activities align to the same strategic direction.
Banks and insurers apply Strategy Deployment to align digital transformation, regulatory compliance, customer experience, and cost reduction initiatives — preventing the initiative overload that characterises most financial services transformations.
- Creates true alignment — every initiative links to strategy
- Eliminates initiative overload — only what matters gets resourced
- Mutual accountability replaces top-down mandate
- Makes strategic progress visible on a single A3 page
- Structured review cadence prevents strategic drift
- Catchball builds genuine commitment, not compliance
- Connects daily Kaizen to 3–5 year breakthrough goals
- Creates organisational learning through PDCA discipline
- Too many priorities — Hoshin requires ruthless focus (max 5)
- Catchball treated as top-down mandate — kills ownership
- X-Matrix completed but reviews never held — planning without PDCA
- Annual objectives set without root cause analysis
- No A3s behind the priorities — execution plan is missing
- Deployed once then abandoned — Hoshin requires annual renewal
- Metrics tracked but not acted on — data without decisions
- No leadership role modelling — leaders must be visible participants
Summary
Strategy Deployment through Hoshin Kanri and the X-Matrix is one of the most powerful and most consistently underutilised management methodologies available to any organisation. Most organisations have strategic plans. Very few have strategic deployment — the disciplined, structured, people-involving process that translates the plan into aligned daily action at every level, verified through regular PDCA reviews, and adjusted based on actual results.
Key Takeaway
The X-Matrix is not the strategy — it is the map of strategic alignment. The Catchball process is not a planning meeting — it is the mechanism that converts top-down direction into bottom-up commitment. The monthly review is not a status report — it is an organisational learning cycle. When these three elements work together — X-Matrix, Catchball, and PDCA review — Strategy Deployment becomes the most powerful force multiplier available to a leadership team: it ensures that the energy, creativity, and improvement capacity of every person in the organisation is directed toward the same few critical goals, rather than scattered across hundreds of disconnected initiatives that collectively produce noise instead of breakthrough.
An organisation can have a brilliant strategy and still fail to execute it — if the strategy is not deployed. Deployment means that the person on the shop floor, in the call centre, or at the patient bedside understands how their daily improvement work connects to the company's 3-year breakthrough goal. When that line of sight exists — when the person closest to the work sees the strategic reason for their kaizen — the strategy becomes unstoppable. Start with three breakthrough objectives. Build one X-Matrix. Run one Catchball. Hold one monthly review. The rest will follow.
Video embedded from YouTube · Strategy Deployment & Hoshin Kanri · youtube.com/watch?v=n6e2EBIKY1Y