How to Create a Value Stream Map: Examples, Expert Tips, and Harnessing AI
Value stream maps help businesses understand the full picture of the steps involved in delivering a product or service. This article will help you create value stream maps in order to analyze and improve your processes.
Table of Contents
What Is a Value Stream Map?
A value stream map is used in manufacturing and management to visually represent the steps that a product or service goes through, from order to final delivery. Use a value stream map to create a comprehensive view of a process in your business and identify inefficiencies and improvement opportunities.
Key Elements in a Value Stream Map
A value stream map has a few key elements that are necessary to demonstrate the flow of a product or process accurately.
- Changeover Time: The amount of time it takes for a machine to be reconfigured, rebooted, and cleaned before starting a new part of the production process.
- Cycle Time: The time between one completed output and the next completed output.
- Information Flow: Lines and arrows show the direction of the process and the timing and order of each process step.
- Kaizen Bursts: Japanese for improvement - short-term improvement projects represented by spiky circles on the map.
- Lead Time: Total time from customer order to final product delivery, including all wait time.
- Non-Value-Added Activity: Any part of the process that doesn't add value.
- Process Metrics: Defect rates, inventory levels, and efficiency indicators.
- Process Steps: Each step represented with a box on a linear map.
- Processing Time: Duration of each process step.
- Product Family: Group of products going through similar processing steps.
- Takt Time: How fast production needs to be to keep up with customer demand.
- Value-Added Activity: Parts of the process that add value and benefit the customer.
How to Create a Value Stream Map
The value stream map is a type of Lean process map that helps identify unnecessary bulk in your process and visualize how to make it more efficient.
1Define the Problem
Go through the entire process and outline the problems you see. This is called walking the flow - physically walking through each step and gathering information.
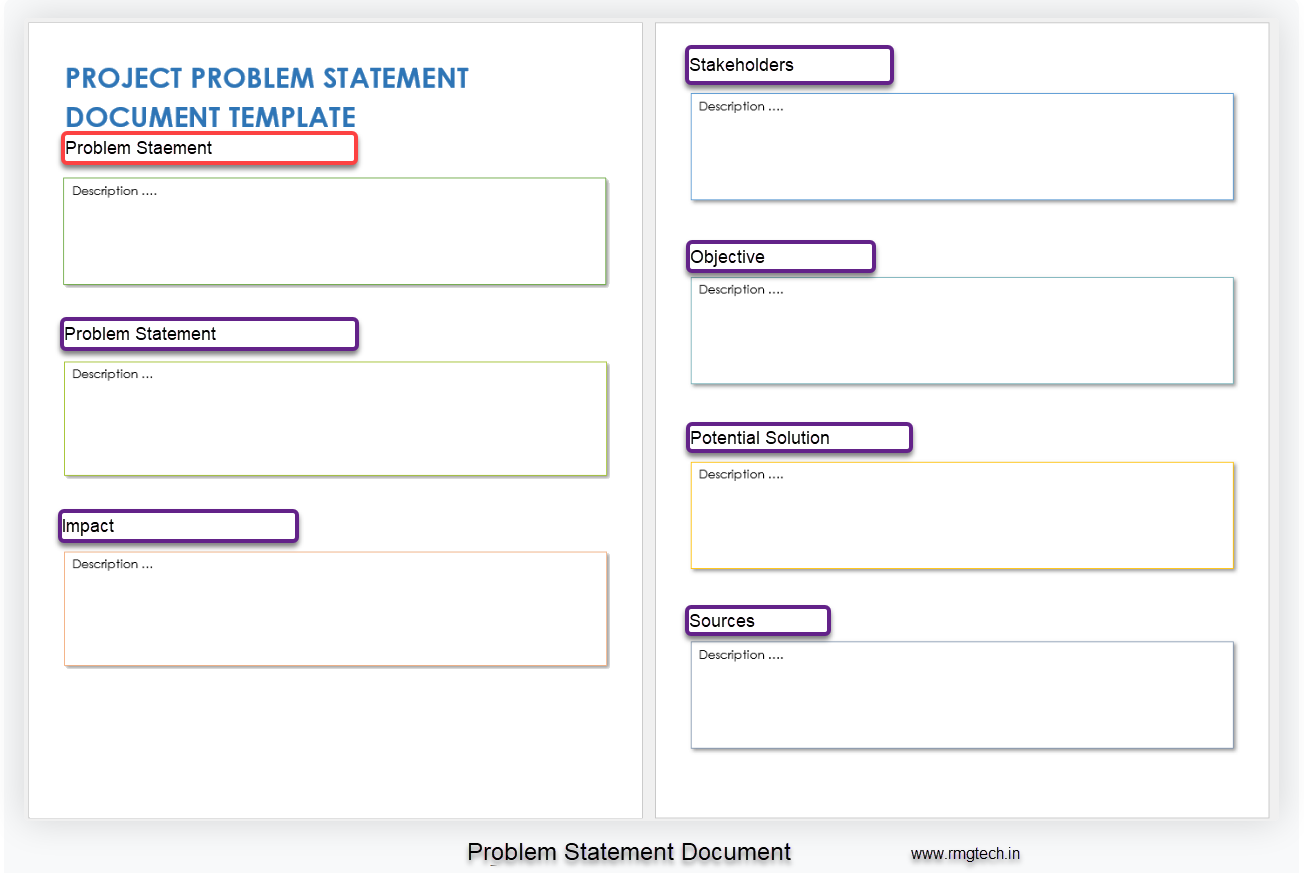
2Assemble a Team
Assemble all relevant individuals and departments for the Kaizen kickoff - a short, focused meeting to attack the issue. Discuss the problem statement and establish your schedule and responsibilities.
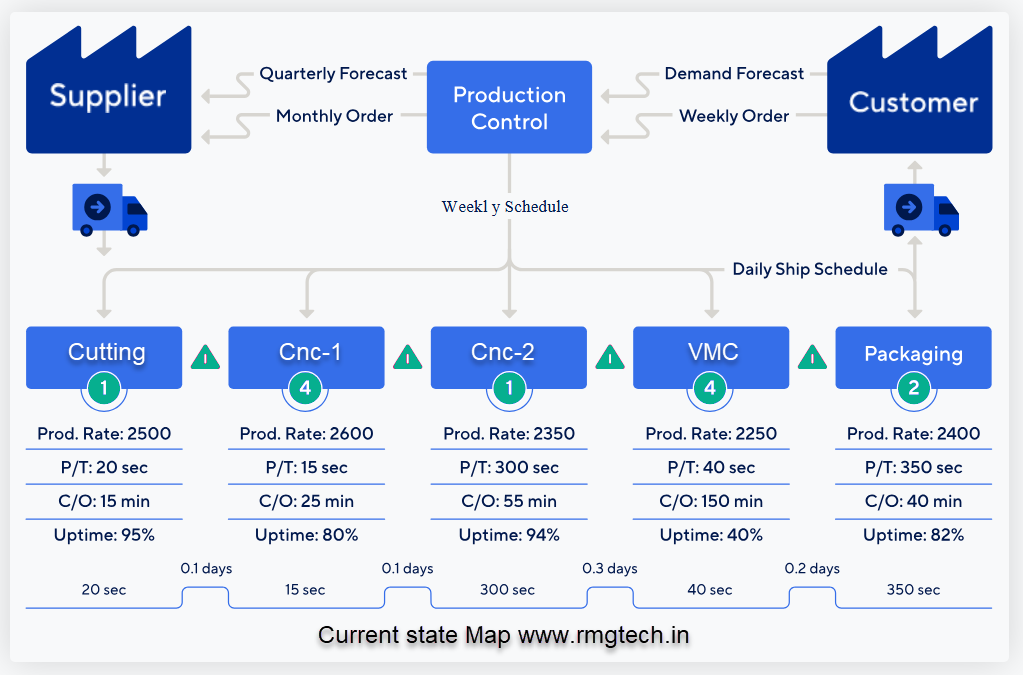
3Draw a Current State Map
Walk the flow again, collect data and metrics, and note potential problems. Draw a box for each process step, connect with arrows showing flow direction. Include lead time, cycle time, inventory levels, and other process data.
4Create a Future State Map
Conduct value stream analysis to identify improvements. Note miscommunication points, bottlenecks, excess wait times, overproduction, and waste. Create a map depicting an improved process.
5Implement an Action Plan
List all steps required to move from current to future state. This could include equipment upgrades, process changes, or new practices. Assign responsibilities, set timelines, and execute.
6Monitor Action Plan
Schedule regular check-ins with team members and assess data to ensure process improvement. Document deliverables and check-in dates.
Value Stream Map Symbols
Use standardized symbols to create clear and universally understood value stream maps:
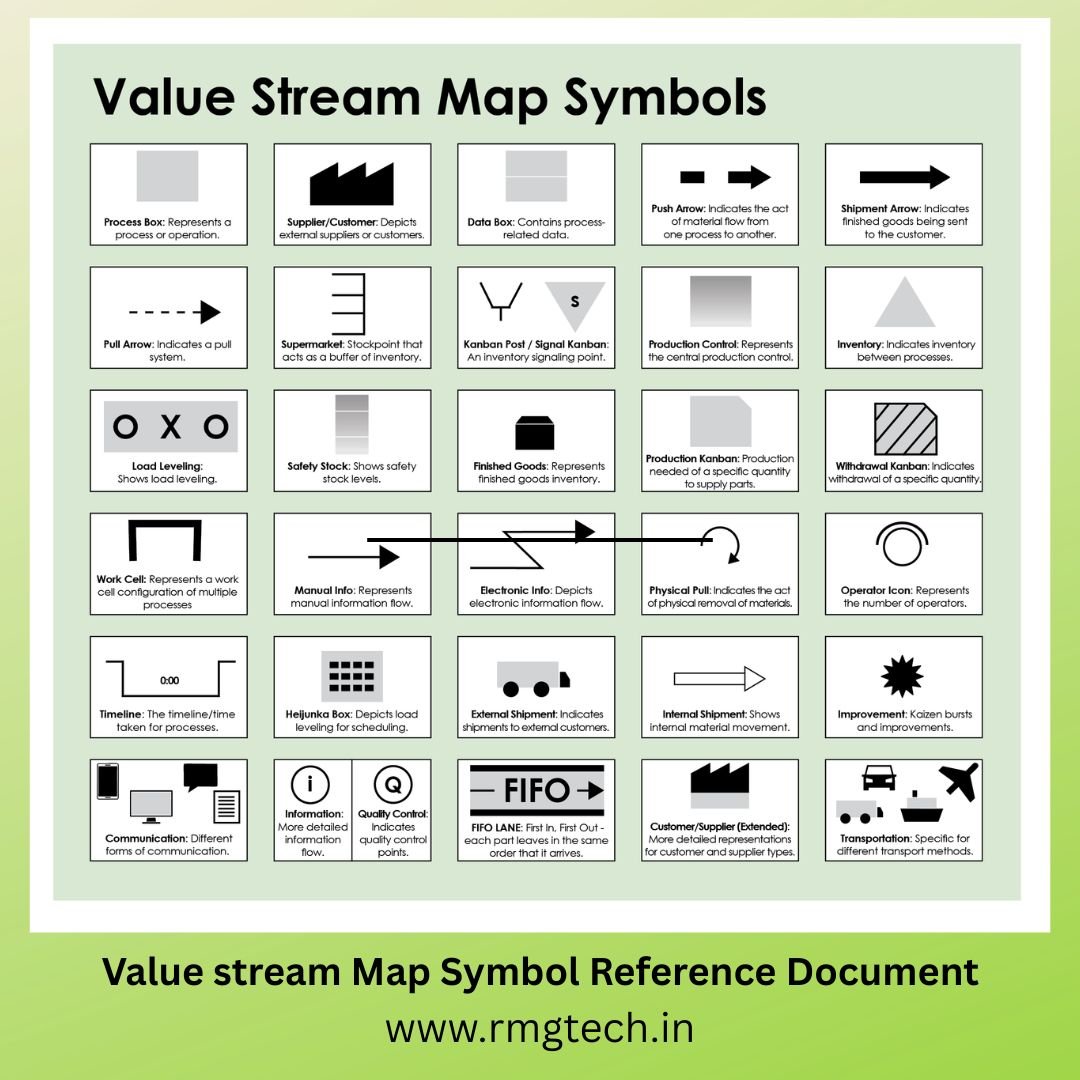
- Supplier and Customer Icon: Squares with jagged tops at beginning and end of map
- Process Step Box: Contains duration, takt time, non-value-added time, wastage
- Push Arrow: Checkered arrow showing material moving between processes
- Shipment Arrow: Solid bold arrow indicating finished goods delivery
- Electronic Information Line: Zigzag line for digital information flow
- Kaizen Burst Icon: Jagged circle for improvement activity points
- Shipment Icon: Truck icon for final product delivery
Value Stream Map Examples
1. Basic Value Stream Map
Use this template to lay out process steps, calculate processing time, and visualize the entire supplier-to-customer process.
1. Basic Future state Value Stream Map
Use this template to lay out process steps, calculate processing time, and visualize the entire supplier-to-customer process.
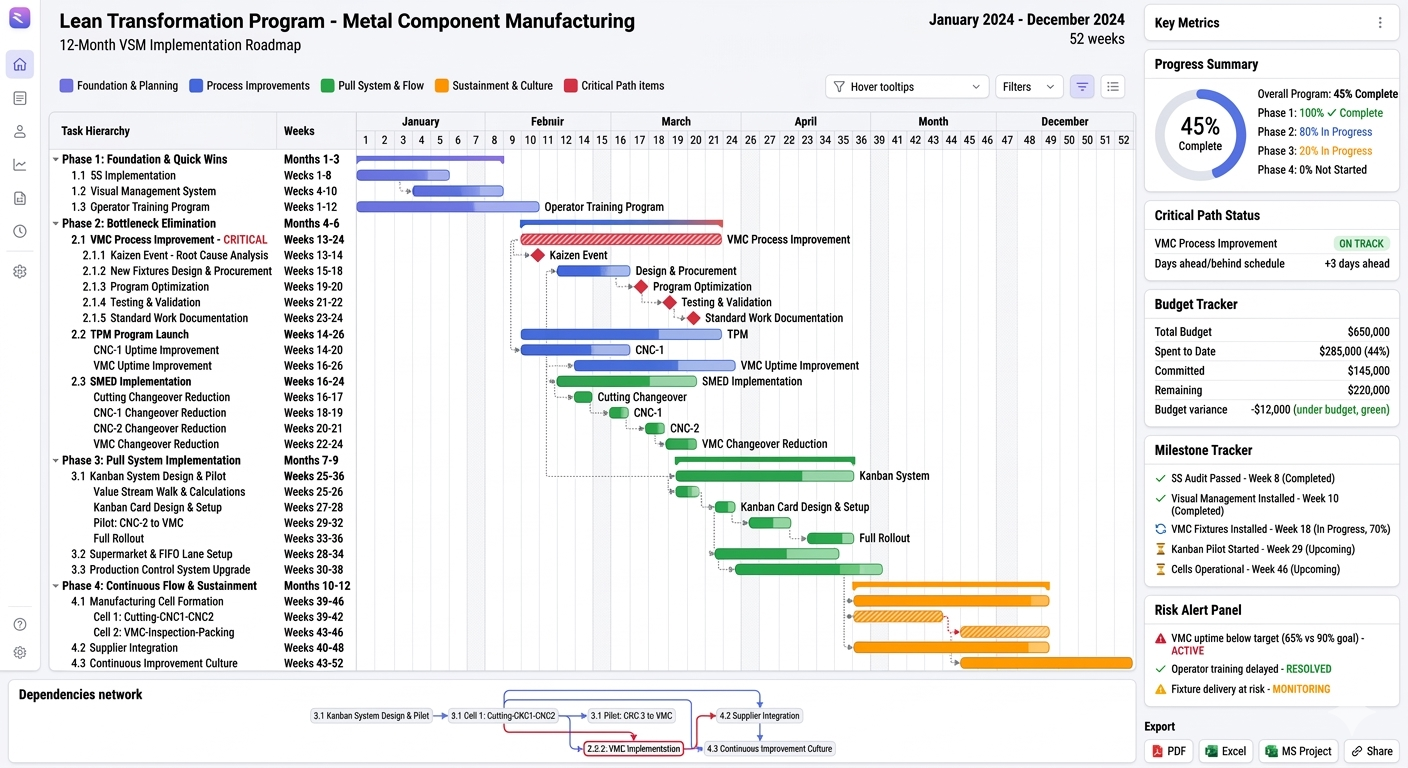
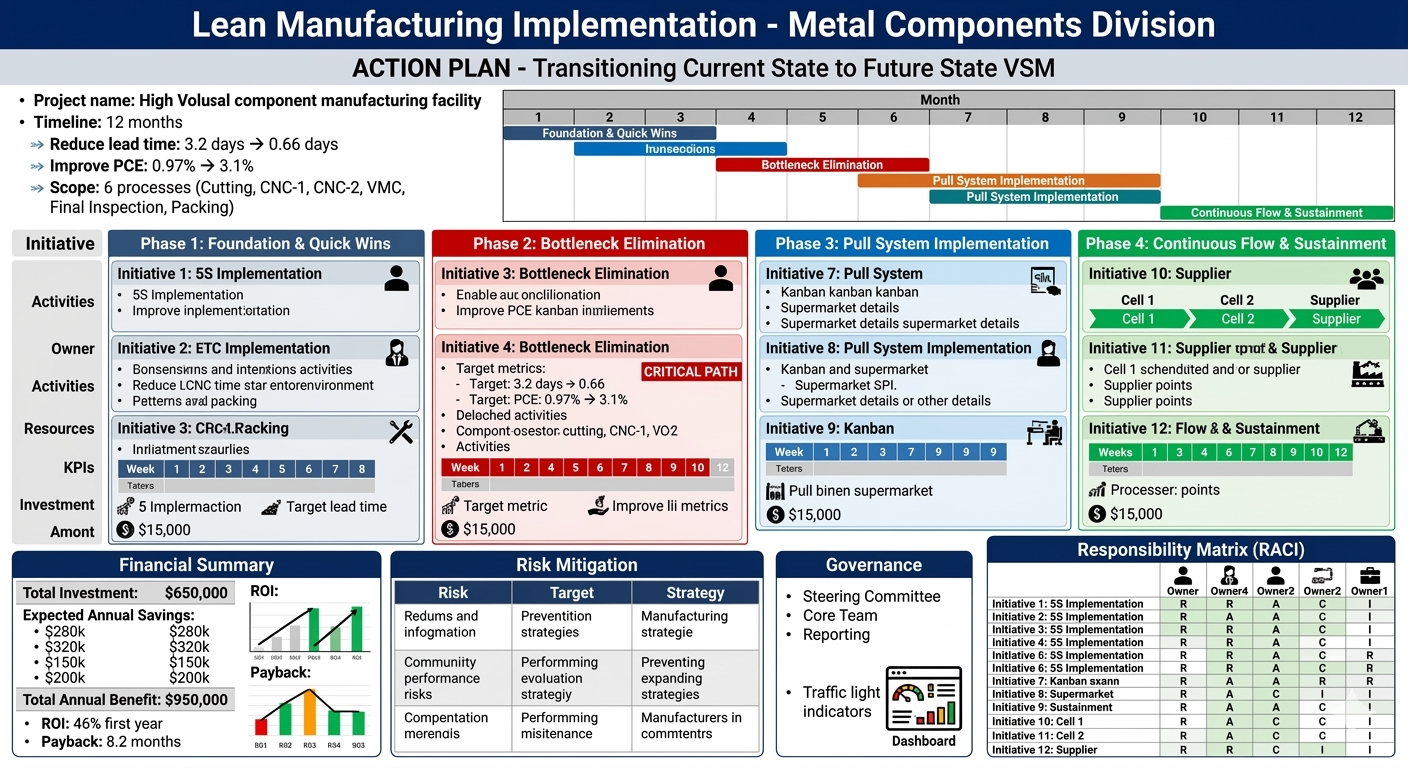
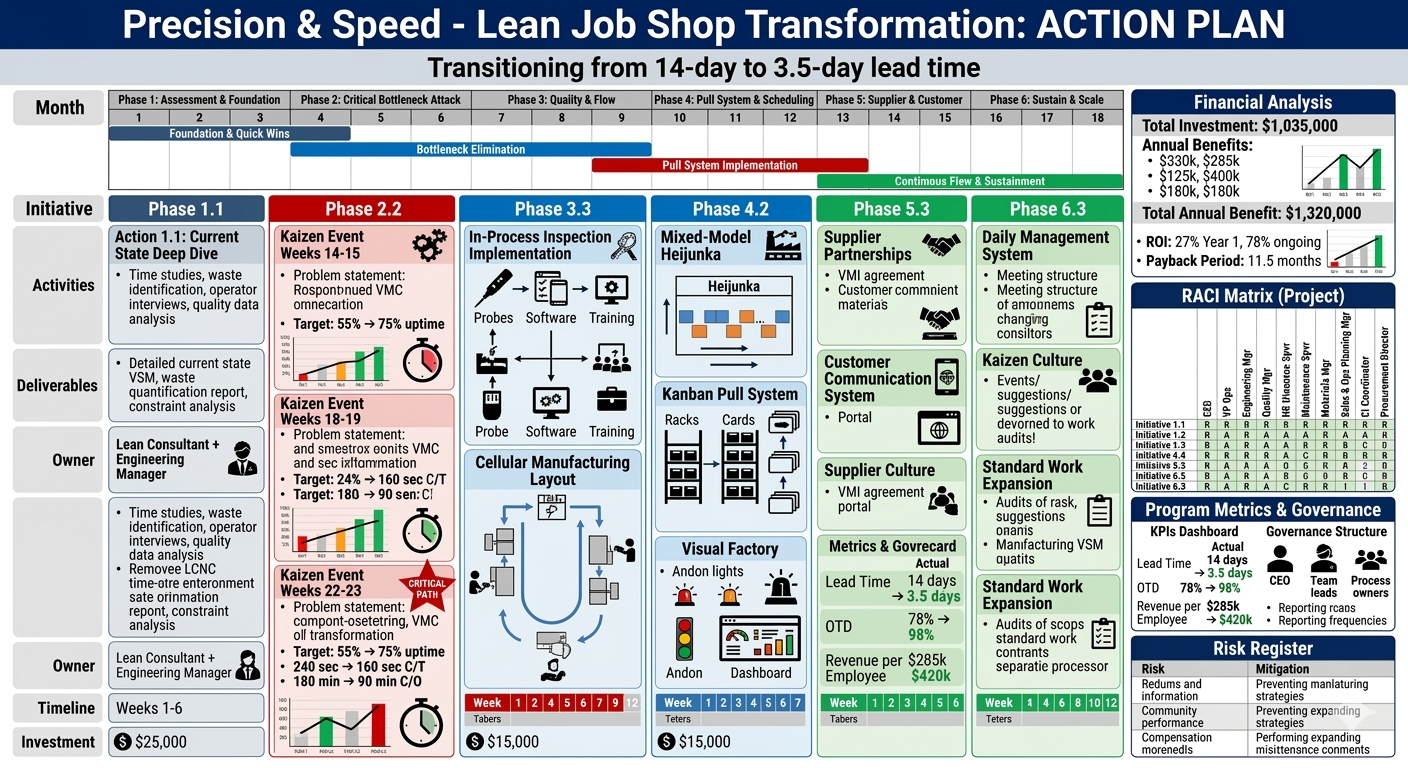
1. VSM Execution Action Plan
Use this template to lay out process steps, calculate processing time, and visualize the entire supplier-to-customer process.
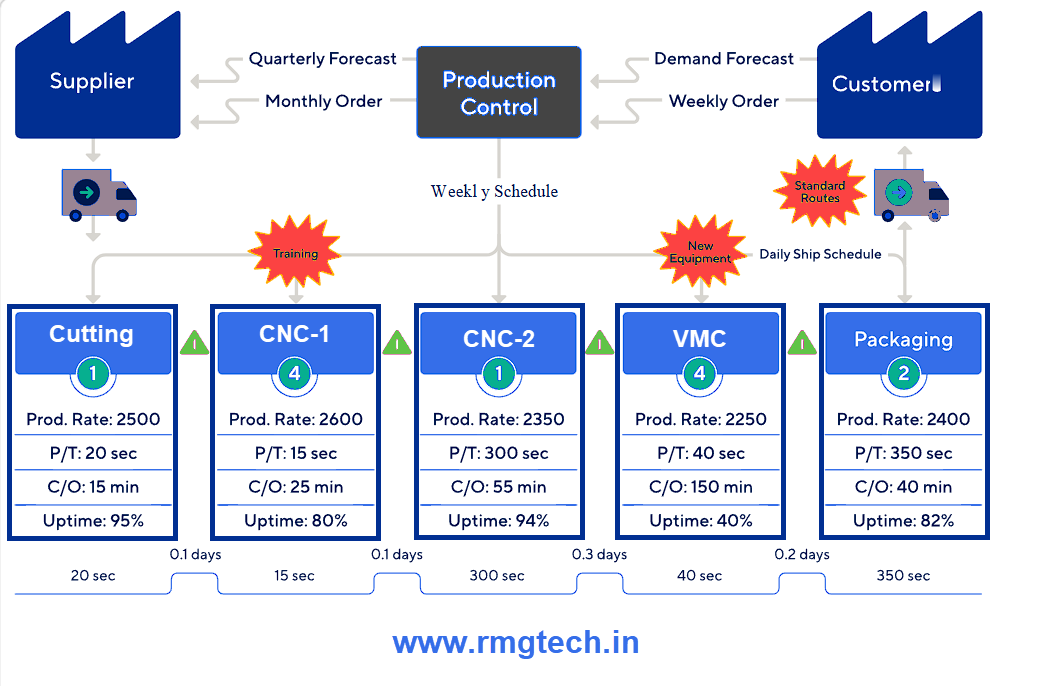
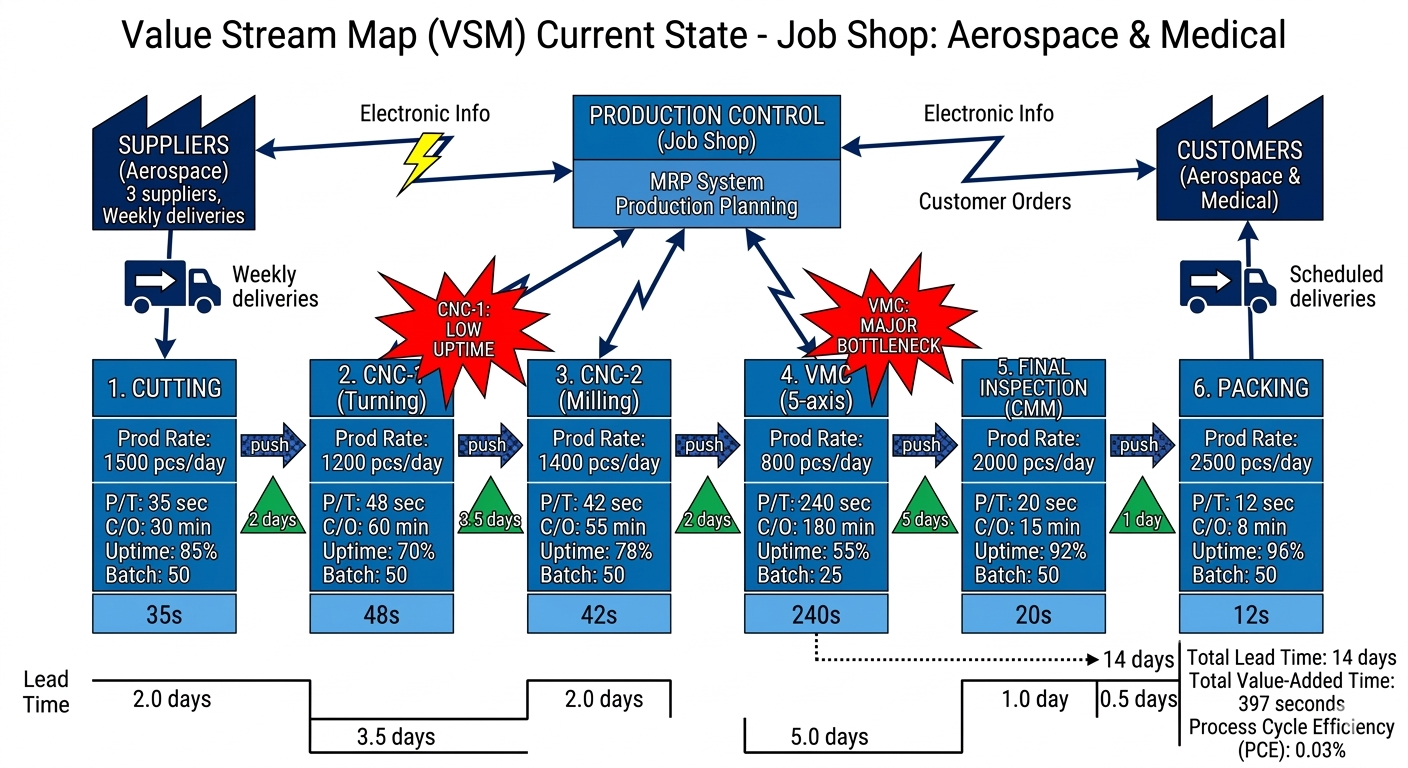
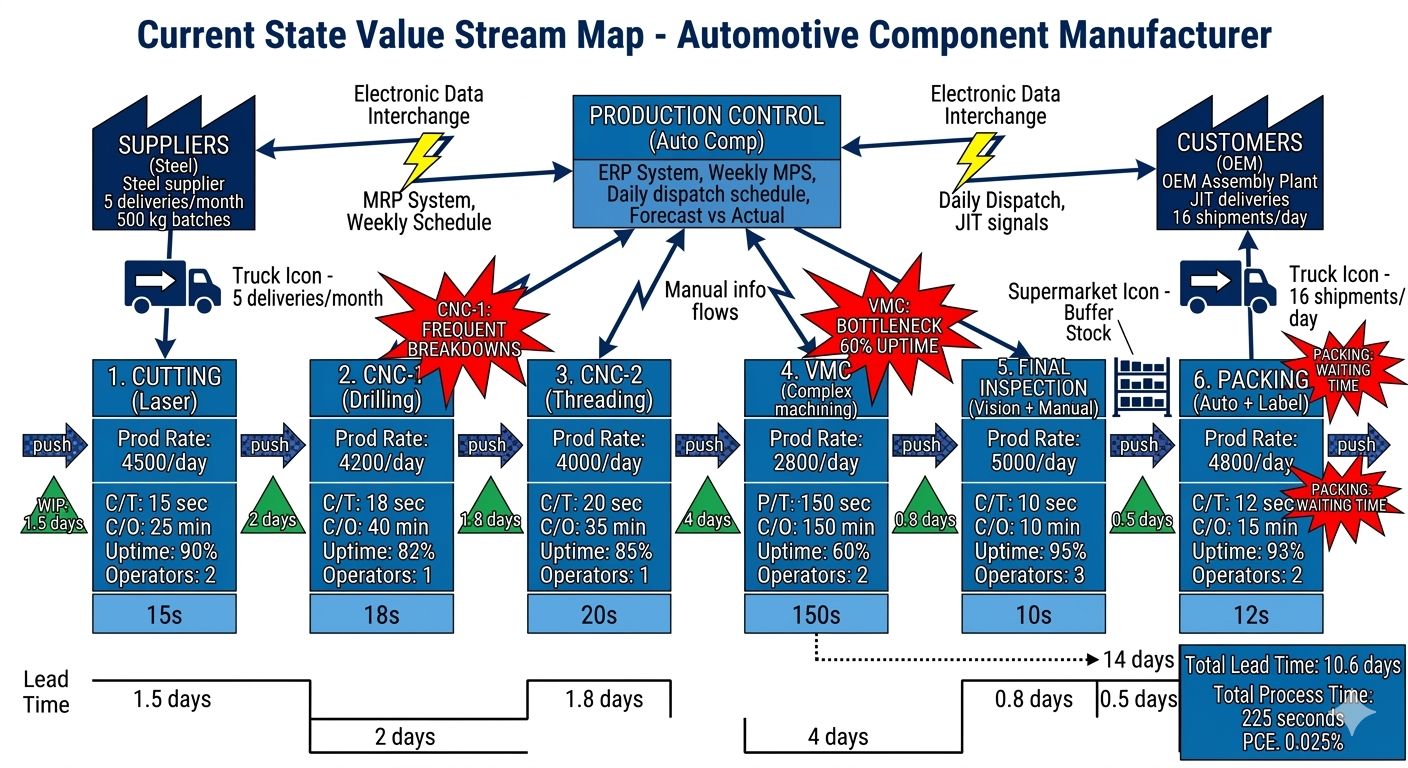
2. Current State Value Stream Map
Detailed breakdown for each process step to easily visualize where to tackle potential issues.
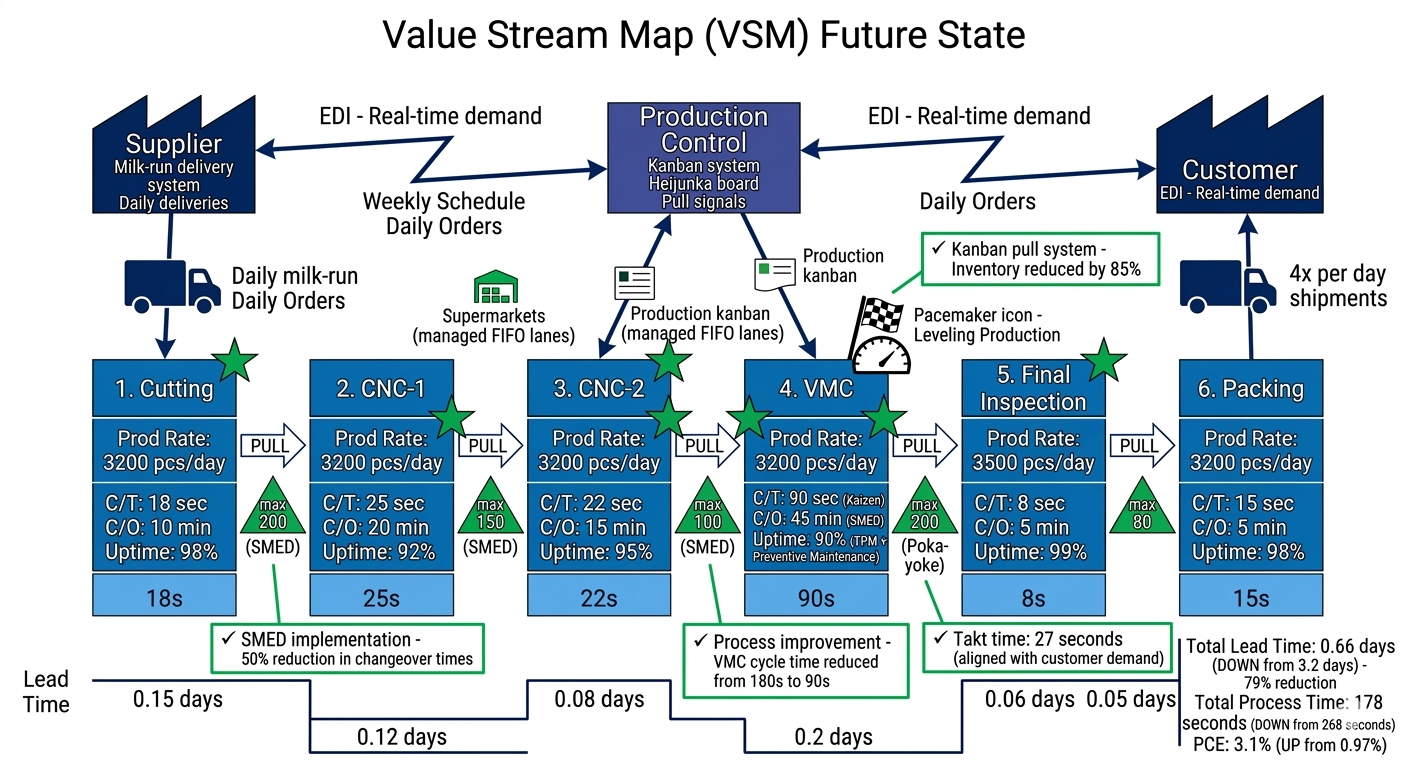
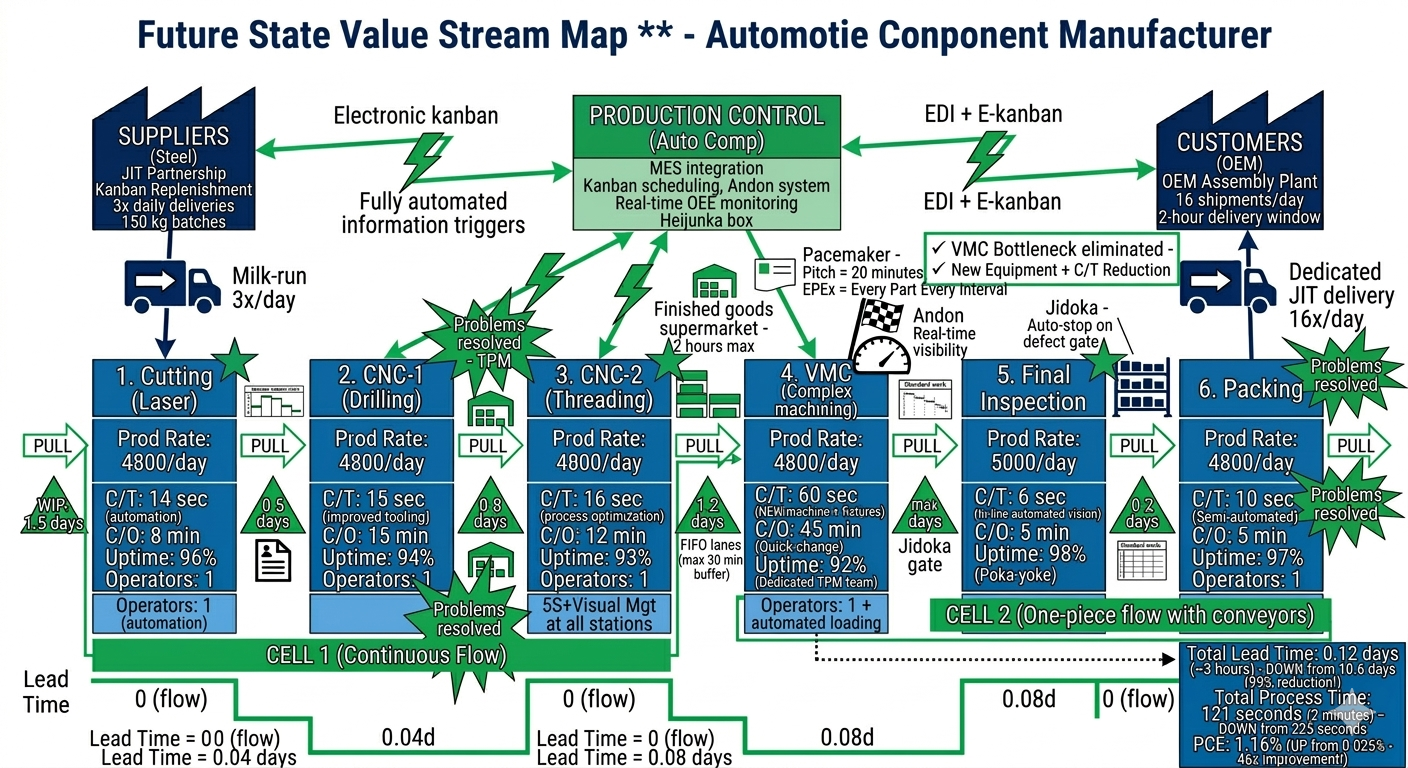
2. Future State Value Stream Map
Detailed breakdown for each process step to easily visualize where to tackle potential issues.
2 VSM Execution Action Plan
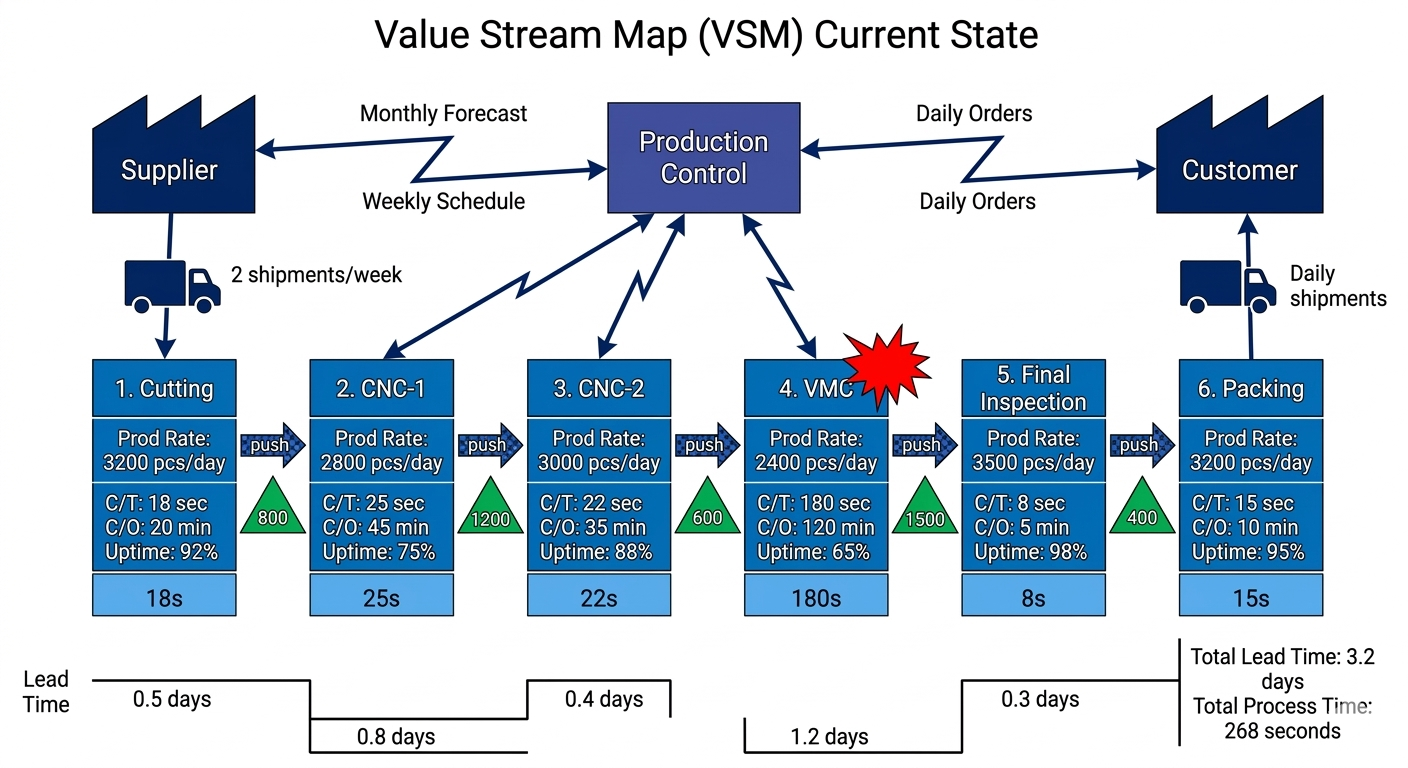
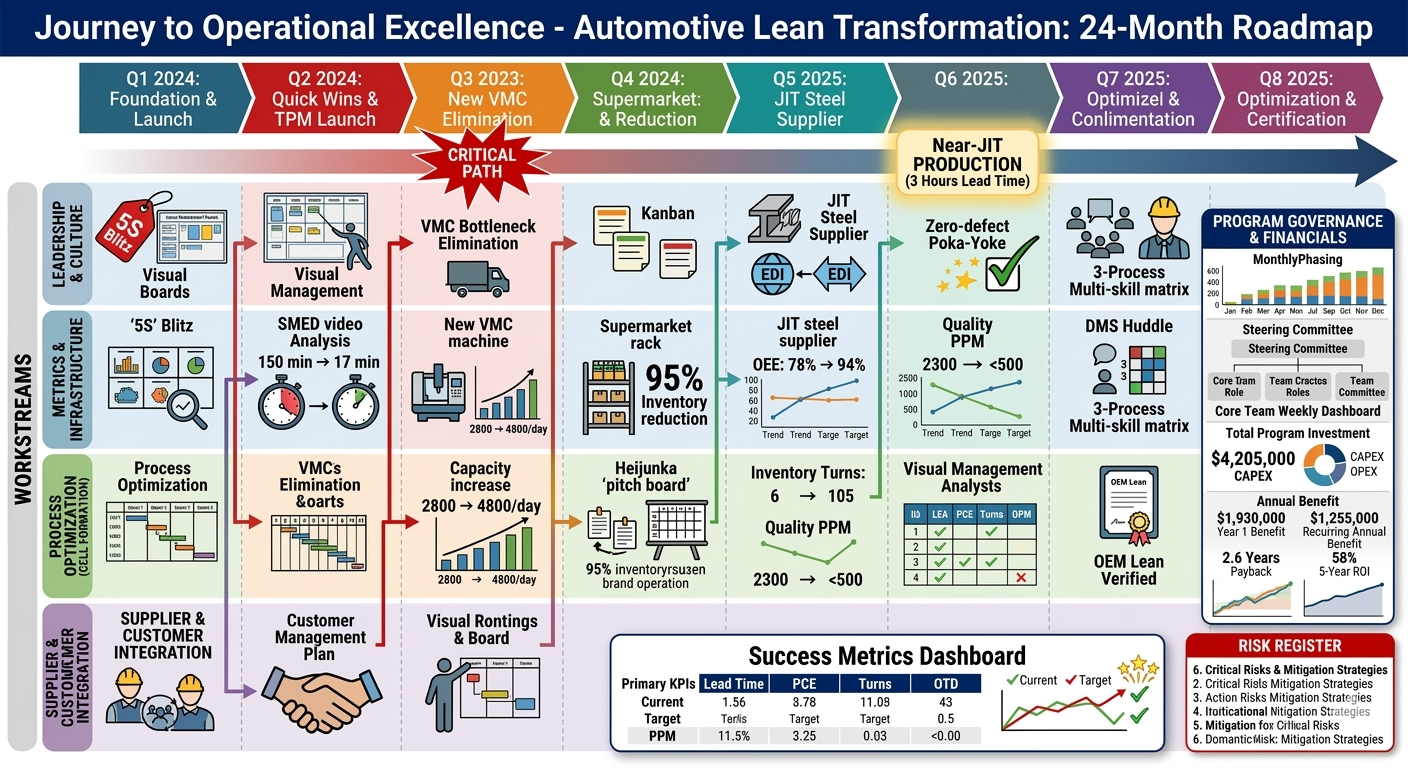
3. Current State Value Stream Map
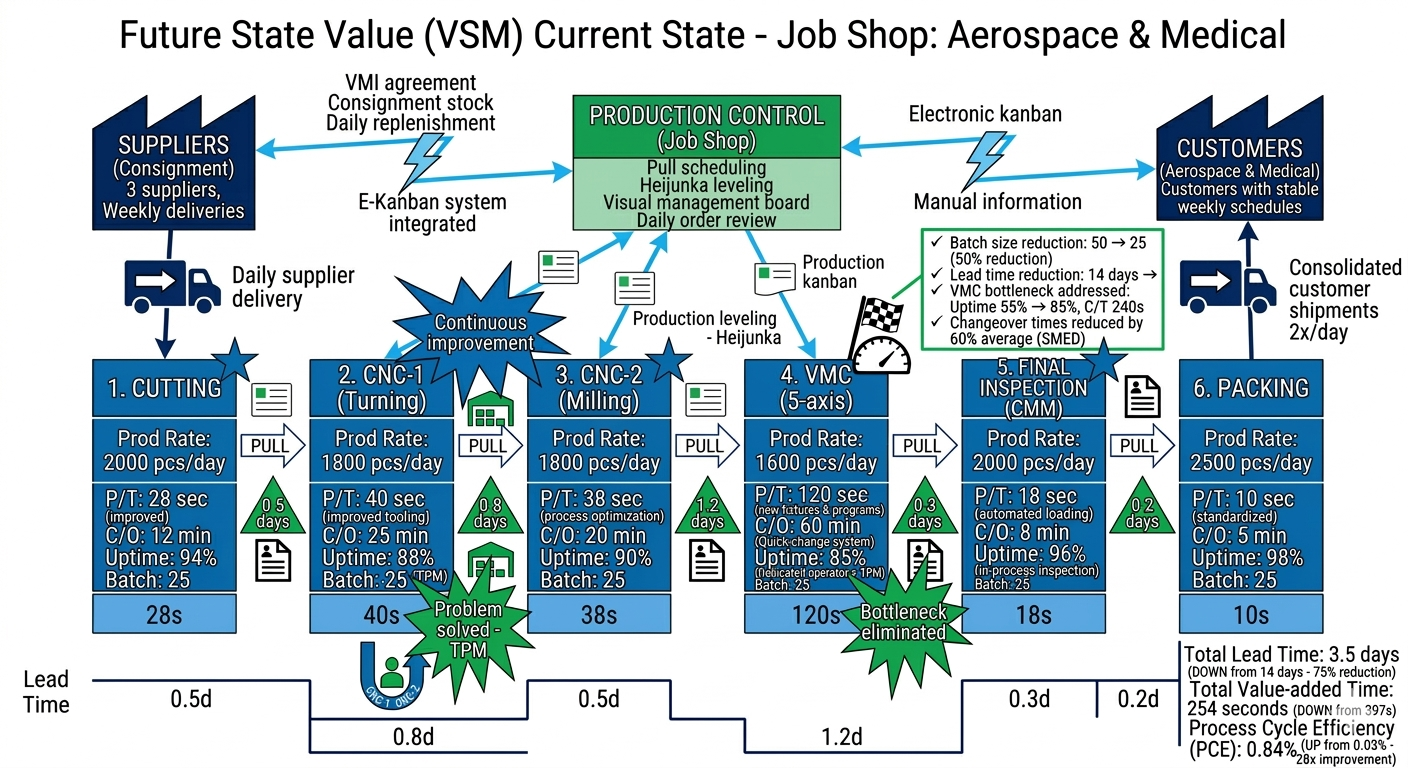
3. Future State Value Stream Map
2 VSM Execution Action Plan
How AI Can Help With Value Stream Mapping
Key Benefits of AI in Value Stream Mapping:
- Automated Data Collection: Reduces repetitive tasks and human error
- Real-Time Updates: Maps update automatically with current data
- Immediate Problem Flagging: Quick issue identification and alerts
- Root Cause Analysis: Identifies underlying process problems
- Activity Classification: Distinguishes value-added from waste
- Predictive Analytics: Forecasts bottlenecks, delays, and demand fluctuations
- Security Implementation: Identity verification and vulnerability testing
- Customer Feedback Integration: Holistic analysis and optimization
AI can automate data collection and analysis, revealing bottlenecks and improvement opportunities. It identifies patterns to predict future bottlenecks, process errors, production delays, and fluctuations in demand and supply. AI can even suggest new pathways to avoid predicted outcomes.
AI programs can identify root causes of problems, implement security protocols, process customer feedback, and create evaluative summaries that enable holistic analysis and optimization of your processes.